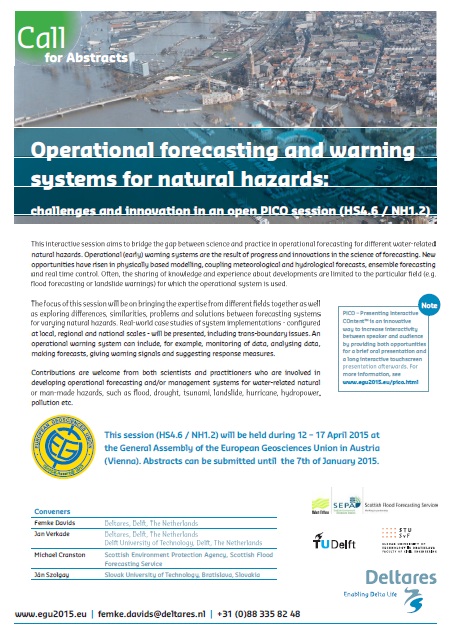
PICO session on operational forecasting and warning systems for natural hazards: challenges and innovation (HS4.6/NH1.2)
Attending the European Geosciences Union Assembly this year? If you’re a first-time visitor to the event, which attracts over 12,000 delegates, then check out the GeoLog’s guide on what to expect.
If you are attending then why not join us in our Thursday morning session on operational forecasting and warning systems for natural hazards. This interactive PICO (Presenting Interactive COntent) session aims to bridge the gap between science and practice in operational forecasting for different water-related natural hazards and has been organised jointly with Deltares, Delft University of Technology and the Slovak University of Technology. The focus of the session will be on bringing the expertise from different fields together as well as exploring differences, similarities, problems and solutions between forecasting systems for varying natural hazards. Real-world case studies of system implementations – configured at local, regional and national scales – will be presented. There are 25 presentations and all the abstracts can be viewed here – we’re at PICO Spot 2 from 8:30.
The General Assembly of the European Geosciences Union held at the Austria Centre Vienna between the 12th and 17th April 2015.
Following the West Highland heavy rainfall event of last October the forecasting service recently had to again respond to a forecast of potentially extreme rainfall in a similar area over the past few days.
Met Office Numerical Weather Prediction 48 hour forecast
The rainfall event was well forecast with a lead time of several days, with the Met Office deterministic forecast giving totals of around 200mm in two days in some areas, the forecast staying consistent from day to day.
G2G forecast of high flows for 8/3/15 (lead time 3 days)
The event proved to be a good test of the Grid-to-Grid (G2G) model, with additional factors such as snow melt and the influence of lochs and reservoirs to be taken into account.
Grid-to-Grid indicated widespread very high flows in the north west, which led to a medium flood risk (significant impacts likely) indication on the Flood Guidance Statement.
The forecasts of peak flow for selected sites in the main area of concern are given below, along with the actual gauged peak flows. The forecast hydrographs for Camisky on the River Lochy are also shown.
G2G forecasts for the peak of 7 or 8/3/15 run at 0730 each day shown. Gauged flows are unverified at present.
G2G forecasts for Camisky (River Lochy)
The rainfall forecasts proved to be very reliable, with a number of gauges reporting more than 100mm and in some cases up to 200mm over the two day event. The consistency in the rainfall forecast led to consistency in the G2G forecasts. Uncertainty in both snowmelt (modelled within G2G) and the action of lochs and reservoirs (not explicitly modelled) meant that we erred on the side of caution, and estimated flood risk to be medium rather than low, given that we were seeing the highest flows ever recorded by G2G at some sites.
Flows in the Easter Ross and Great Glen area proved to be among the first or second highest in records of around 40 years. Grid-to-Grid forecasts turned out to be slightly overestimated, but the modelled areal extent of the highest flows and the impacts, was very accurate. Impacts were widespread though relatively low level. These included several road closures and extensive flooding of agricultural land over a wide area, isolated property flooding, damage to the Caledonian Canal and a caravan park that had to be evacuated. The River Ness was out of bank in Inverness, resulting in some disruption to a sporting event.
River Ness at Inverness, 8/3/15
Higher confidence in the snow melt element is needed, which we hope to address through a study over the coming year. Incorporating better reservoir and loch operation into Grid-to-Grid is also clearly something that should be investigated in future.
When the inaugural SNIFFER Flood Risk Management conference was convened in 2005 many of the current approaches to flood risk management were very much in their infancy – if at all conceived. 10 years on and the ‘FRMis10’ conference agenda– Scotland’s key event for exchanging ideas on flood risk management – is dominated with papers on approaches to resilience, natural flood management and climate adaptation. A catalyst for the changing approach has been the Flood Risk Management Act and associated policy drivers and investment. Opening the two-day event, the Minister for Environment, Climate Change and Land Reform – Aileen McLeod MSP – stated “partnership working is one of the key pillars (of the Act)… and it enables agencies to deliver co-ordinated, strategic policies;” this message being echoed further through work to promote partnership working and sharing knowledge (Morgan).
Coastal flood forecasting in Scotland: future developments include new systems and utilisation of ensemble data
Coincidental but in that same year the lessons from the Western Isles storm were being considered which have since seen a step change approach in coastal flood forecasting (Kaye). The Minister enforced this message by stating that ‘as a member of the UK Coastal Monitoring and Forecasting partnership, SEPA has also been involved in driving improvements to monitoring and forecasting in the coastal environment including the commissioning of Wave Buoys around Scotland’s coastline, and a new 7-day surge ensemble forecasting system.’
As Scotland approaches the publication of the flood risk management plans later this year, then what is in store for the next 10 years for flood risk management? The key points for practitioners following this event seem to be data, scale and communication.
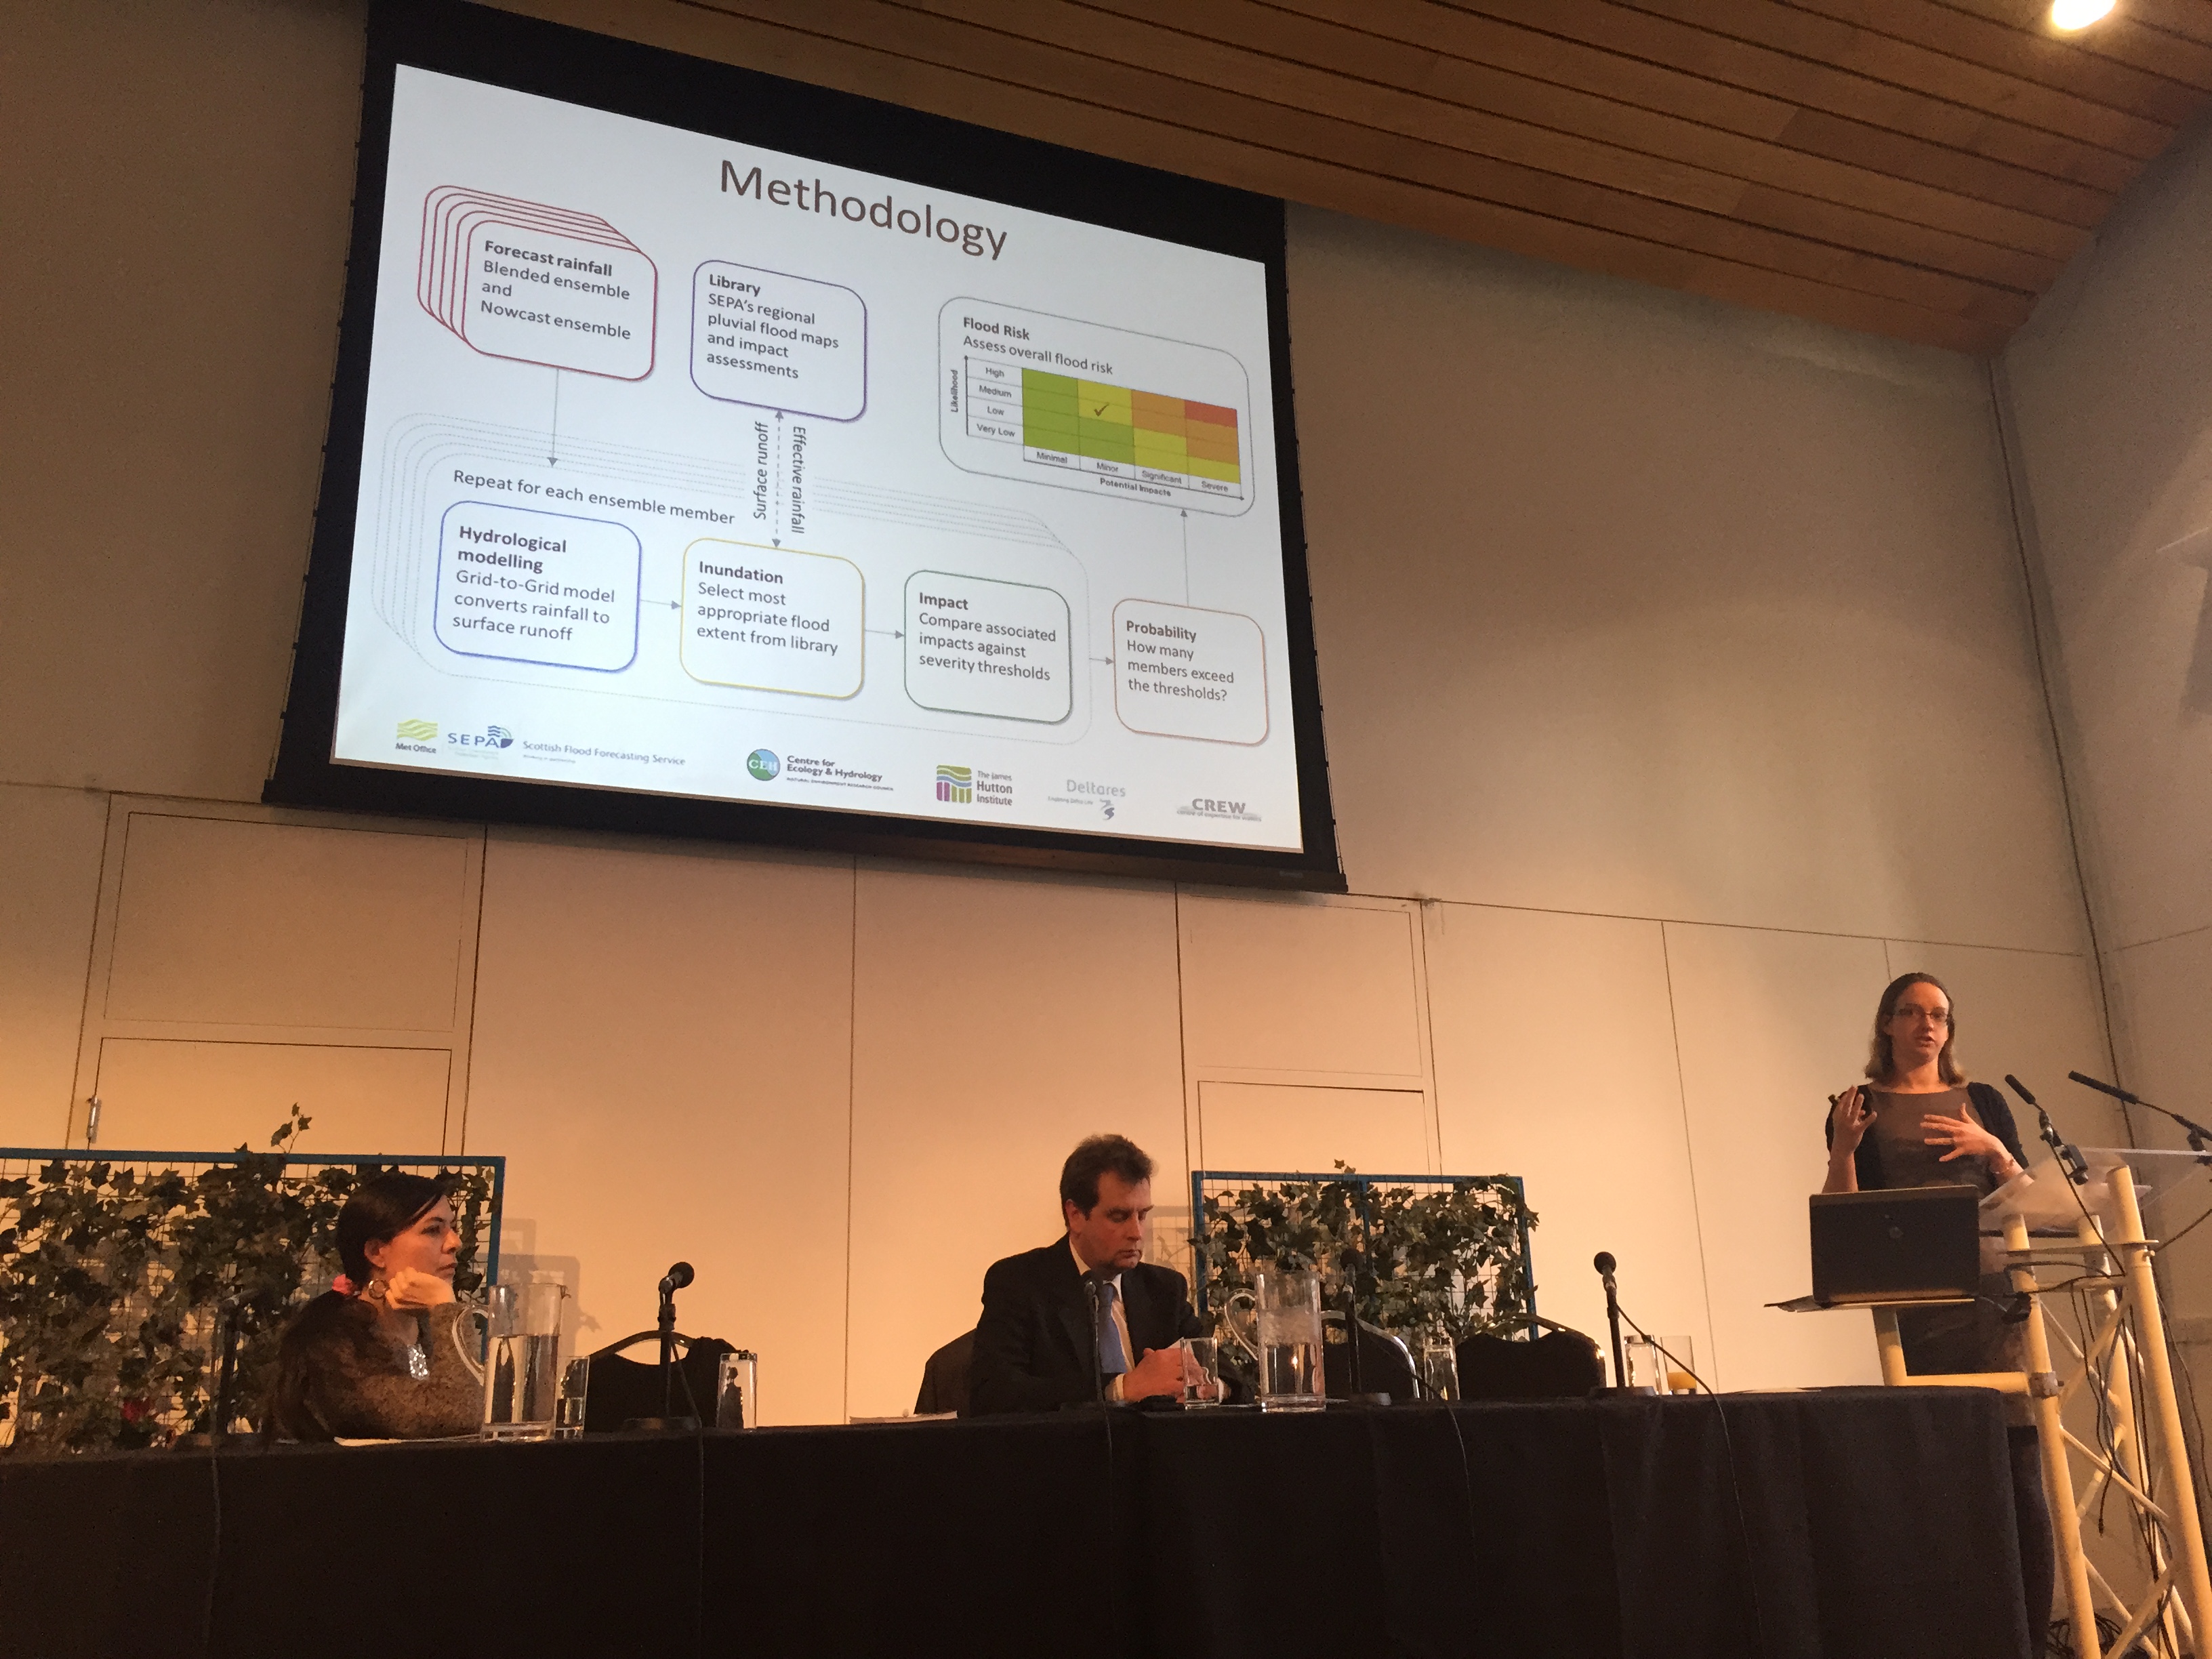
It’s clear that our understanding of the risk has significantly improved over the past decade. Data and information on flood risk in the urban environment has been useful in surface water flood forecasting where a library of information (risk maps) were used to provide real-time representation of the risk to people, property and transport in Glasgow (Speight). However, can this approach be further developed by utilising the underlying urban flood inundation models in real-time and is this appropriate (Falconer)? What about our monitoring networks – what more needs to be done in the coastal environment (Faichney)? Certainly a good case was made for increased use of data through merging raingauge data and radar observations for improved rainfall estimates (Ochoa-Rodriguez).
New approaches to urban surface water flood forecasting using hydrometeorological modelling and impact assesments to support hazard alerting.
There are increasing demands but equally benefits on the scale at which we apply our science. Understanding the rates of coastal erosion can help assess the future risk of flooding (Rennie) and applying hydrometeorological forecasting at a 1km scale can help with hazard alerting (Speight). Likewise applying resilience measures at the community scale through empowering individuals (Throp) and promoting property level protection (Petit) can all have benefits for mitigating flooding as will making flood risk relevant to the individual. Yet who is responsible for maintaining the effort for these initiatives when interest wanes (Cubbage)?
“The language is not easily understood by the man on the street” (Watson). Therefore how we communicate what we do is important and methods for communicating the future risk of climate change and public hazard should be a focal point of research if we are to make most of the science (MacDonald).
.@AileenMcLeodMSP tells .@SnifferScotland conf SG has invested to improve flood warning
As concluded by the Minister, the recent property level protection research has highlighted that with small increases in river or sea level comes a substantial increase in the risk to properties; “Does this imply that the focus of flood risk management in Scotland needs to shift from extreme flood events to the more frequent lower return period floods? If yes, then this has important wider implications for flood risk management in Scotland when so much of our flood risk management focuses on the more extreme flood events.” Furthermore, all organisations should take a proactive role to potential issues by not ‘waiting for the complaints’ (Mustard) and aim to be prepared for the next emergency or hazard (Handling).
The decorations are up and the Christmas presents are wrapped but before we leave the SFFS in the hands of our dedicated meteorologists and duty flood forecasting hydrologists over the festive period, there’s just time to review what has been a busy and successful year for Scotland and the forecasting service.
Train services between Inverness and Aberdeen were disrupted in August given flooding to the track through various stretches in Moray (source: Moray Radio online).
A year ago today we were in the middle of the third wet December in a row with 2013 closing with flooding in Nithdale and Dumfries. Although England and Wales suffered a very wet start to the year, Scotland avoided the worst of the rainfall until the summer. The new Moray flood alleviation scheme (still being constructed in some areas) was tested in August when the tail end of tropical storm Bertha hit the north east of Scotland causing widespread flooding. In October the north west of Scotland saw over 200mm of rainfall in 48 hours illustrating just how much water can be stored in the lochs and reservoirs in the region compared to other areas before property flooding occurs.
The island of Stenness in Shetland faced the brunt of the significant Atlantic waves in the December storm (source: Express.co.uk)
Coastal flooding has been a key focus this year. The 18.6 year tidal cycle peaks in 2014-2015 as the orbits of the sun and moon align. This means we are currently experiencing higher than normal astronomic tide levels which could increase coastal flood risk if combined with weather generated tidal surge and wave conditions. Therefore 2014 was a timely year in which to launch our new Moray Firth forecasting system with a sophisticated coupled modelling approach for offshore to nearshore waves and wave overtopping. We have certainly seen some high seas in 2014 with the December ‘#weatherbomb’ storm equalling the highest ever recorded offshore wave height of 16.4m off the Western Isles.
2014 has also seen major improvements in our surface water capabilities. We launched our first bespoke surface water alerting service for the Commonwealth Games in Glasgow and have learnt some important lessons about what type of information is useful to responders and how to best communicate that information, which we will use to inform the development of our surface water services in the future.
Our new FEWS Glasgow forecasts for afternoon of Sunday 3rd August 2014. Photographs show the conditions at the Games at this time. The risk level had been increased as we got closer to the event as the likelihood increased. (photo credit: http://www.eveningtimes.co.uk, http://www.sportsjournalists.co.uk)
There has been a notable rise in the use of social media in flood forecasting this year. SEPA’s own media team (@ScottishEPA) have been doing a great job of tweeting our flood forecasts and warnings for Scotland and making sure that people know where to find up to date information on flood risk.
Members of the SFFS in The Street at Met Office Exeter during a knowledge/science exchange visit in November 2014
As well as developing our own capabilities, the SFFS has been involved in a wide variety of scientific and engagement activities this year ranging from conferences such as the BHS 2014 in Birmingham, technical meetings including the Delft-FEWS user days and EFAS annual workshop, knowledge exchange visits to other forecasting centres at home and abroad and contributed to major research projects including the NERC Flooding from Intense Rainfall project (FRANC & SINATRA).
Thank you for reading this blog over the year. We hope the 5500+ views have given you a useful insight into the varied operational and development work of the SFFS.
From everyone in the Flood Forecasting Service we wish you all a peaceful Christmas and a flood free New Year.
Recently the flood forecasting service had to contend with the potential impacts of the so called weather bomb. Explosive cyclogenesis – a weather phenomenon which results in rapidly deepening low pressure – occured to the south of Greenland and gave rise to stormy weather conditions including severe gales and lightning strikes across parts of Scotland. For the forecasting service our primary concern was the potential for coastal flooding with very large ocean waves expected to be generated in the Atlantic. However was the increased flood risk status justified?
The island of Stenness in Shetland faces the brunt of the significant Atlantic waves (source: Express.co.uk)
The forecast
The weather situation developed as expected, both in terms of the strong winds and the resultant high ocean waves. Forecasts, including our use of a pilot version of the new Met Office wave ensemble forecasting system (see image), indicated that significant wave heights were likely and in the case of the Western Isles, similar to those witnessed in the devastating 2005 storms. Other coastal flood forecasting tools were predicting some minor wave risk and flooding to Loch Linnhe, a moderate surge for the Firth of Clyde and a more significant surge (1 metre) near Cape Wrath, however astronomical tides were relatively low, which helped mitigate any overall exceptional sea levels.
Predictions from non operational test wave ensemble system from Monday 8th December for the Cefas WaveNet site off the West of Hebrides. (c) Met Office.
Flood guidance
As the media interest built up so did the social media reaction to the weather bomb phenomenon. For the flood forecasting service the risk was highlighted some five days out, with likely significant flooding impacts being advised for the exposed western coasts of the Western and Northern Isles two days ahead. The resultant response to the combined weather and flood hazard warnings led to numerous transport services being cancelled, schools being closed on the Western Isles due to the dangerous conditions and a Scottish Government led co-ordination with responders.
The storms did cause significant disruption in the Western Isles and Orkney, with much of this due directly linked to lightning strikes and the severe gales. The challenge for the forecasting service in these cases remains in the evaluation of potential flooding impacts. Where new approaches to forecasting wave modelling and overtopping in the near and onshore environment have been used, such as the Firths of Moray and Forth, estimates of flood inundation can be provided. However, in the more remote island and coastal zones no direct link between wave height and flood risk has been established.
Thankfully this storm passed without any significant flooding with some potential impacts well managed due to effective action of road and causeway closures by responders.
The Weather Network joining in the media interest with their infographic for the coastal flood risk on Wednesday 10th December. SEPA issued Flood Alerts for coastal flood risk for the coastline from Dumfries and Galloway up to the Shetland Islands.
By Michael Cranston and Richard Maxey, Scottish Flood Forecasting Service
Radar is a powerful tool for observing rainfall over large areas in real time. It is also used to produce nowcasts (short range forecasts for the next 6 hours) which are used to provide flood warnings for rapidly responding catchments such as the Ruchill Water in Comrie.
Radar systems work by using an echo-sounding system. Electro-magnetic waves are transmitted and the time taken for the beam to travel back is used to identify the presence of rainfall (if you want to know more there is an excellent guide to the technicalities and history of weather radar available from the Met Office).
UK Radar coverage showing gaps across the Highlands and southwest Scotland
We use radar a lot in the forecasting service but there are some unique challenges with doing so in Scotland;
The radar coverage is inconsistent across the country, particularly in Dumfries and Galloway and the Highlands, including Inverness
The mountainous nature of the landscape means that the radar might not be able to “see” in all directions as the beam is blocked by hills
The post processing algorithms do not fully account for orographic enhancement of rainfall over high ground
Radar doesn’t perform very well when it is snowing due to the different reflective properties of snow compared to rain
Good quality observations of rainfall are essential to support our flood forecasting and warning capabilities. We asked the Met Office to review the radar coverage in Scotland to help us better understand where we can be confident in our forecasts and where we should target improvement. Unsurprisingly the report found that when compared to rain gauge data the areas identified above have a lower detection efficiency than the rest of Scotland, largely due to distance from the radars.
Probability of Detection (POD) of rainfall by radar compared to raingauge showing marked increase in radar quality in the Central Belt compared to other areas of Scotland
SEPA are now considering alternative methods of improving flood forecasting and warning capabilities in areas where radar quality is poor. This might involve making better use of the UKV forecasts directly in some of our catchment models rather than using nowcast or possibly to trial temporary radar in areas not sufficiently served by the UK-Composite.
In addition the Met Office are currently carrying out a radar renewal programme as well as developing techniques to correct for beam blockages and orographic uplift which will hopefully benefit Scotland in the future.
Worsfold, M. Norman, K and Harrison, D (2014) Analysis of weather radar coverage over Scotland using a high density tipping bucket rain-gauge network, Met Office
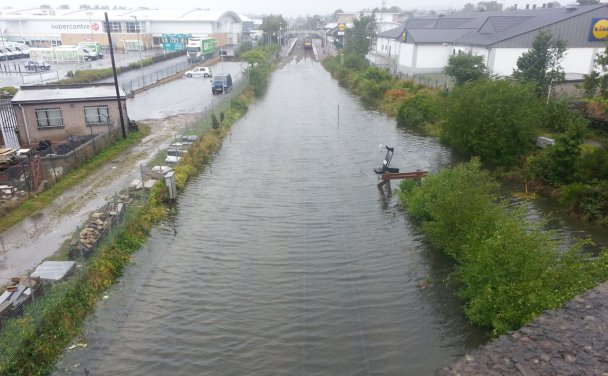
Over the past few days the forecasting service has faced an interesting challenge. Large amounts of rain were forecast to fall in north west Scotland, caused by warm moist air being driven by gale force winds over the high ground of the west Highlands. Accumulations of the order of 200 mm in two days were expected.
Met Office rainfall forecasts available to the forecasters during the days leading up to the event
Flood Guidance Statement extract showing medium (amber) and low (yellow) risk areas
The challenge of risk based flood forecasting in the Highlands is that our understanding of potential impacts is less than for more populated parts of Scotland. In addition to the Grid-to-Grid model we have rainfall depth duration guidance figures to help with the initial Flood Guidance Statement risk assessment. A lack of data (both on flood events and on river levels) hampered the original derivation of figures for this area, and on this occasion the forecast totals exceeded the 12 and 24 hour guidance figures considerably. A decision was taken to assign a medium (amber) risk status, indicating likely significant impacts. This also matched with the National Severe Weather Warning status for the area.
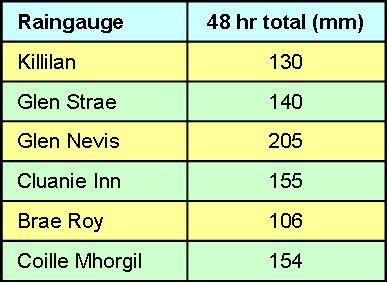
48 hour rainfall totals at some of SEPA’s raingauges in the affected area (NB data not yet validated)
In the event, the rainfall happened as forecast, with over 200 mm being recorded over 48 hours in some areas. There was significant transport disruption, with a number of major routes being blocked by landslides. Apart from flooding of agricultural land and some roads, there was very little in the way of property flooding. The major rivers did not reach extreme levels, partly due to extra storage being available in the lochs and reservoirs following a relatively dry spell. The level of disruption specifically caused by flooding fitted our defined minor (rather than significant) impact definitions. The rainfall was of comparable magnitude to that occuring during the ex-hurricane Bertha event during August; the difference being that the August event affected the east flowing rivers that drain into heavily populated areas, and involved very intense rainfall over relatively short periods, whereas this latest event mostly (but not entirely) affected the west facing more sparsely populated catchments, and involved rainfall spread over a prolonged period of two or more days.
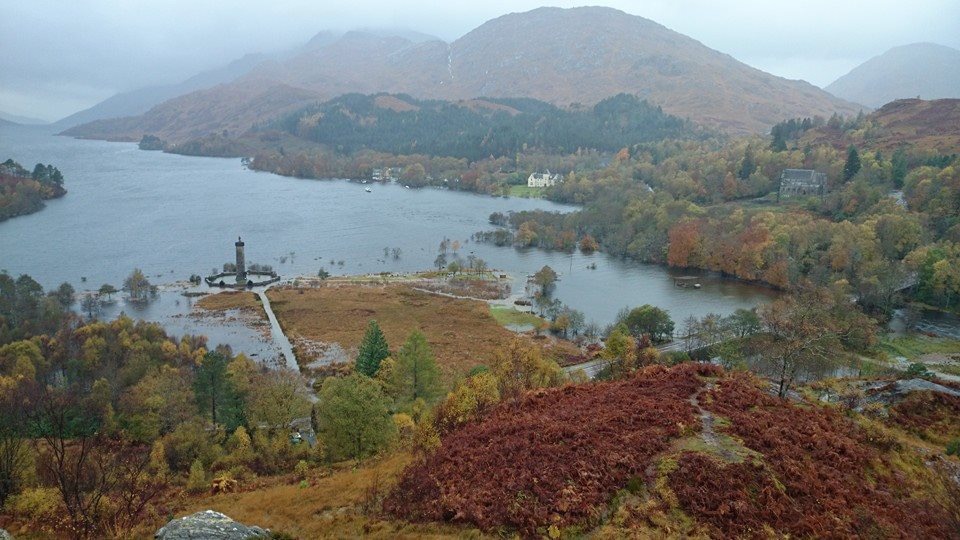
Glenfinnan Monument near Fort William is cut off by flood waters (facebook, unattributed)
The consistent rainfall forecasts meant that we were prepared several days in advance, and the meteorological event didn’t come as a surprise. Following the event we have identified that we need better guidance on impacts from prolonged large total events in this area. This should come from ongoing work in this area, linking river flows to impacts. The role of lochs and reservoirs in influencing river flows in this area also needs to be better quantified.
The data gathered this week will help us to judge this for the next time a 100+ mm event comes along in this area. We will also need to carefully consider the conditions (initial states and rainfall depths and durations) that might lead to a future severe flood in the north west of Scotland.
Luckily the weather during the Games was largely fine however there were occasions when the additional surface water guidance provided a real benefit to organisers and responders. This took two forms, firstly enabling the SFFS to advise that although heavy rainfall was forecast in the wider West Central Scotland region and we had flood alerts in place, flooding impacts in Glasgow itself were unlikely. Secondly, as was the case on the last weekend of the Games shown below, to provide information on the timing, likely impacts and probability of possible flooding in Glasgow.
FEWS Glasgow forecasts for afternoon of Sunday 3rd August 2014. Photographs show the conditions at the Games at this time. The risk level had been increased as we got closer to the event as the likelihood increased. There were reports of minor impacts across Glasgow over the weekend. (photo credit: www.eveningtimes.co.uk, www.sportsjournalists.co.uk )
The project has provided a unique example of operational surface water flood forecasting and has generated interest from other operational centres and researchers in the UK and abroad. An overview of the project has been published today on the Hydrological Ensemble Prediction EXperiment (HEPEX) website and on the NERC Flooding from Intense Rainfall project blog.
There will be a final meeting with members of the steering group later in October to discuss how we can take forward the lessons learnt from this project to help develop our surface water flood forecasting capabilities across Scotland in the future.
In a previous post we discussed what lessons should be learned from the winter storms of 2013-14 and how any recommendations should be taken forward and developed in the future. In Scotland, forecasting waves is a relatively new endeavour and the recent events in the Decembers of 2012 and 2013 as well as January 2014 highlight that more has to be done in developing this aspect in future flood forecasting projects in other areas of Scotland. As we approach the peak of the 18.6yr tidal cycle late in 2014 and throughout 2015, coastal flooding has rarely had a higher or more intense focus than at present.
The Moray Firth Flood Forecasting System is the largest coastal flood forecasting project ever undertaken in Scotland, covering in excess of 500 miles of coastline from Wick in the north to Fraserburgh in the north-east. In December 2012 and again in December 2013, numerous communities along the Moray Firth coastline were victims of two differing types of flooding; wave overtopping and tidal surge, highlighting the region’s vulnerability to coastal flooding from multiple sources.
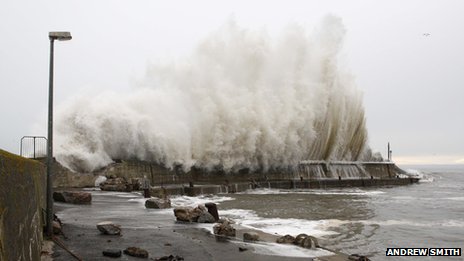
Waves overtopping the harbour wall at Portmahomack during December 2012 storm.
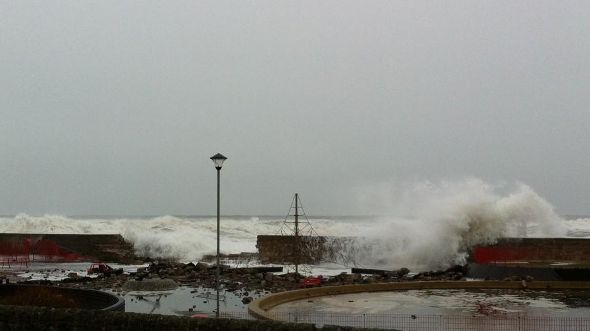
Waves overtopping the sea wall at Lossiemouth during the December 2012 storm, causing severe structural damage and flooding a park. Copyright: Barry Peach
It had been identified before the project commenced that wave overtopping is a key risk to communities in the Moray Firth and that quantifying this risk should be key component of the system. The 2012 event was largely wave driven and caused significant damage to harbours and shoreline properties, with an estimated £2.4m worth of damage caused in the Highland Council region alone. In 2013, a storm surge event propagated around the UK coast and although effects were focussed in SE England, preliminary data shows the UKCMF tide gauge at Aberdeen measured a 22yr return period (RP) for this event. In January 2014, another spring tide event occurred with Wick recording a 6yr RP. These three events in 13 months have heightened awareness amongst Government, local authorities and members of the public that more needs to be done to help minimise associated impacts from these types of events in the future.
The Moray Firth forecasting system will provide a sophisticated coupled modelling approach, including modelling waves from an offshore to nearshore environment in addition to wave overtopping modelling at selected sites. JFlow modelling software was utilised by the project team to create inundation mapping for the 14 wave overtopping sites, in order to gain an advanced appreciation of flow paths and high risk areas within these communities. The resulting Flood Warning Target Areas (FWTAs) have been largely based on these maps.
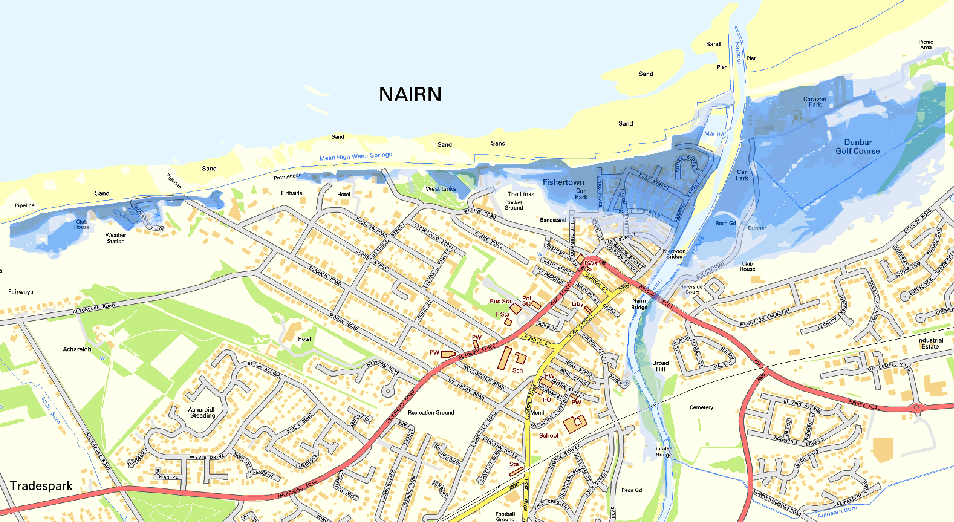
Modelled flood inundations from wave overtopping at Nairn, utilising JFlow modelling software. Set rates of overtopping were used to highlight where in the town will be most at risk during an event (darker blue shaded areas). Copyright: SEPA
In the Moray Firth modelling approach, a SWAN model (Simulating WAves Nearshore) has been developed comprising of an triangular mesh, allowing for coarser resolution in open water and finer resolution nearer the coast. This SWAN model will use data operationally from strategically-placed sample points, taken from the Met Office’s Euro 4 wave model (part of the Met Office Unified Model), propagating these around the model domain as appropriate. Each forecast location will show the output time series in metres, with the 14 wave overtopping locations then applying additional calculations to quantify the rate of overtopping in litres per metre per second (l/m/s). SEPA’s Flood Warning Duty Officer (FWDO) will then be able to analyse the wave conditions and model output, in conjunction with other variables such as SWL, wind direction etc, and relay this information with likely impacts to key responders and partners.
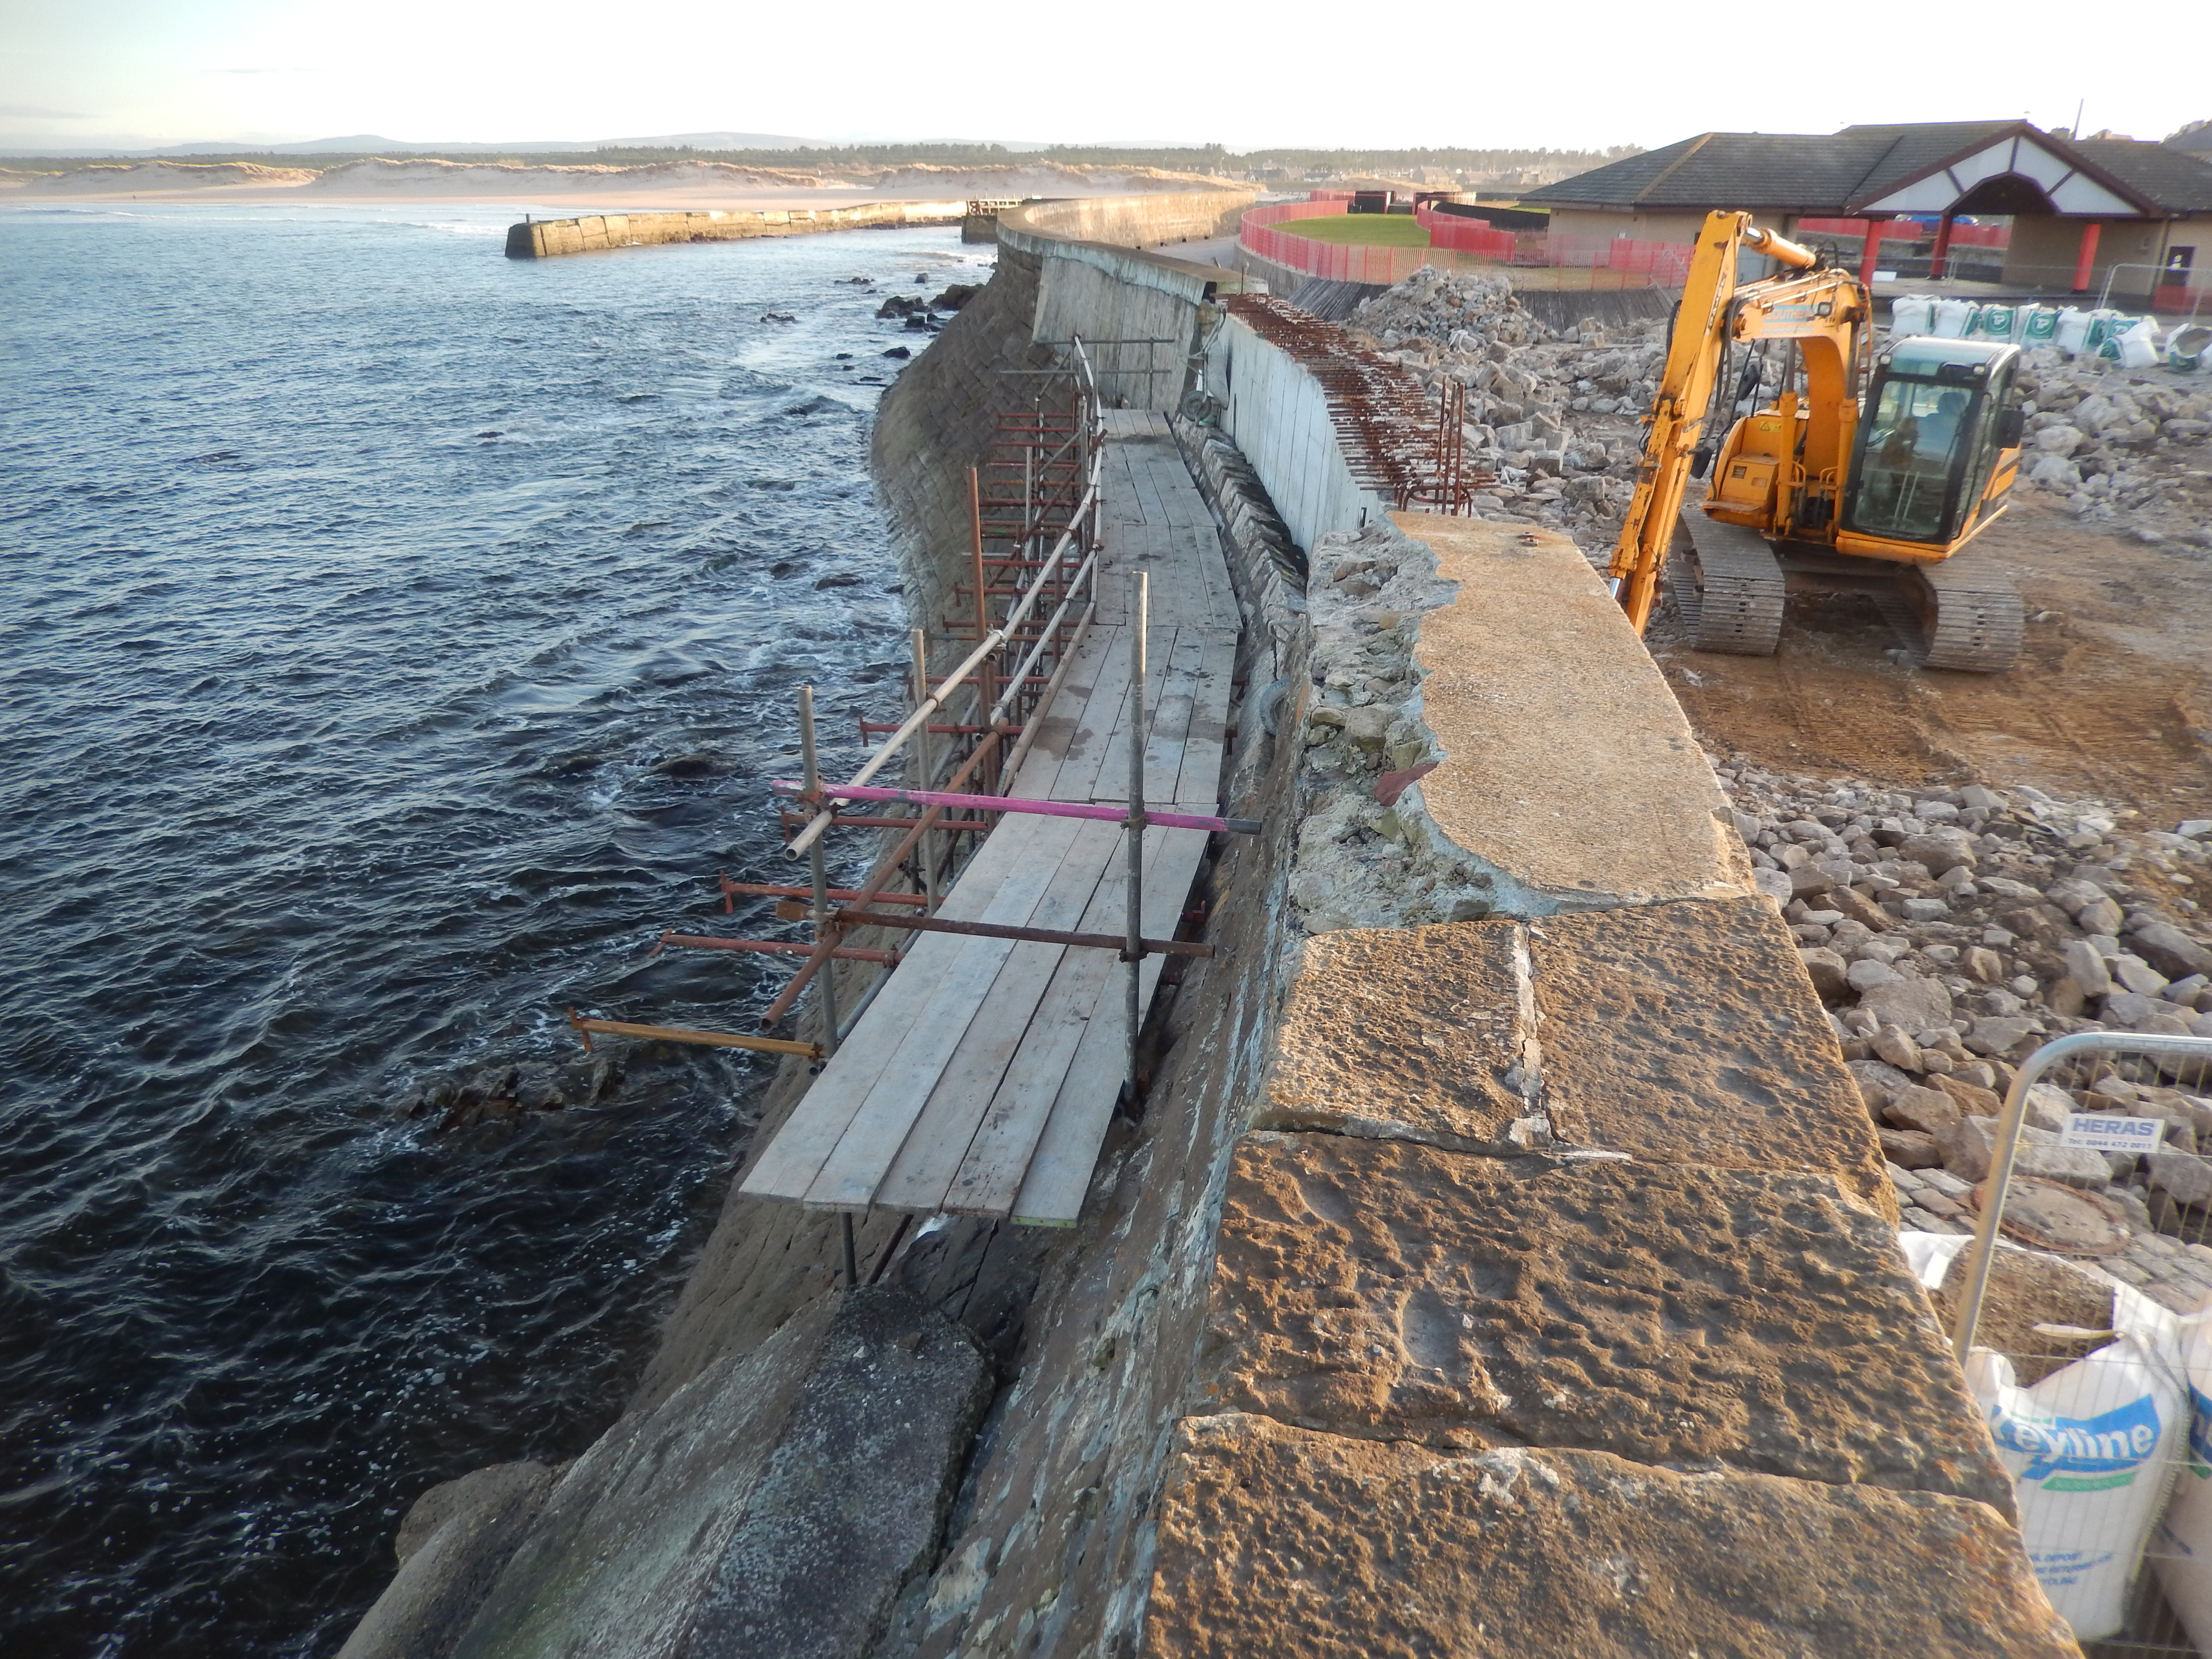
Ongoing repairs to Lossiemouth’s seawall as at 10 March 2014. Copyright: Darroch Kaye
The project team have utilised the WaveNet hindcast dataset to aid calibration of the models and to assess its performance against a lengthy still water level (SWL) time series. This 30yr 8km gridded dataset has been generated by running the WAVEWATCH III model, used operationally by the Met Office until the recent migration to the Euro4 wave model, with a wind field generated from re-analysis of historic observations. Wind forcing from downscaled 10m global wind fields from the ERA-Interim re-analysis, as provided by European Centre for Medium-Range Weather Forecasts (ECMWF), is also incorporated. There are 48 output parameters from the hindcast including significant wave height, mean wave direction and wave period, which in turn can be used to calibrate and verify wave models as well as recreate past events. More information regarding the differing types of ocean modelling the Met Office utilise can be found here.
The project is expected to be completed in early September 2014, with the forecasting system going live at the beginning of October 2014.
There was a wide range of talks covering droughts, floods and snow, to water resources and governance. Here are some interesting things I didn’t know before this week:
The June 2012 surface water flood in Newcastle saw 51mm of rain, 26mm of which fell in 30 minutes. However this wasn’t the largest event on record for the city, in 1941 50mm fell in 30 minutes! (David Archer JBA / Newcastle University)
It might be possible to predict snow cover in Scotland, particular for low lying ground, early in the season based on the North Atlantic Oscillation. Unfortunately there is no evidence yet that this would help us predict snowmelt flooding. (Michael Spencer Edinburgh University)
The flow volume in the River Thames for winter 2013/2014 was more than the previous two largest events combined (Chris Beales Environment Agency)
Historic flood evidence might be even more challenging to consider than I previously thought with people moving historic flood stones or putting them in years after the event (Colin Clark CHRS)
For me though the key message of the week, which came through in several talks but particularly from Glen Watts and Craig Woolhouse (both of the Environment Agency), was a call for the hydrologists of the future to be better communicators to make sure that decision makers can use our great science to help saves lives and livelihoods. Not an easy task when working against the sensationalised backdrop painted by the media, but rather than focussing too much on figurers and statistics we should learn to tell relevant stories of our own to get the key message across.
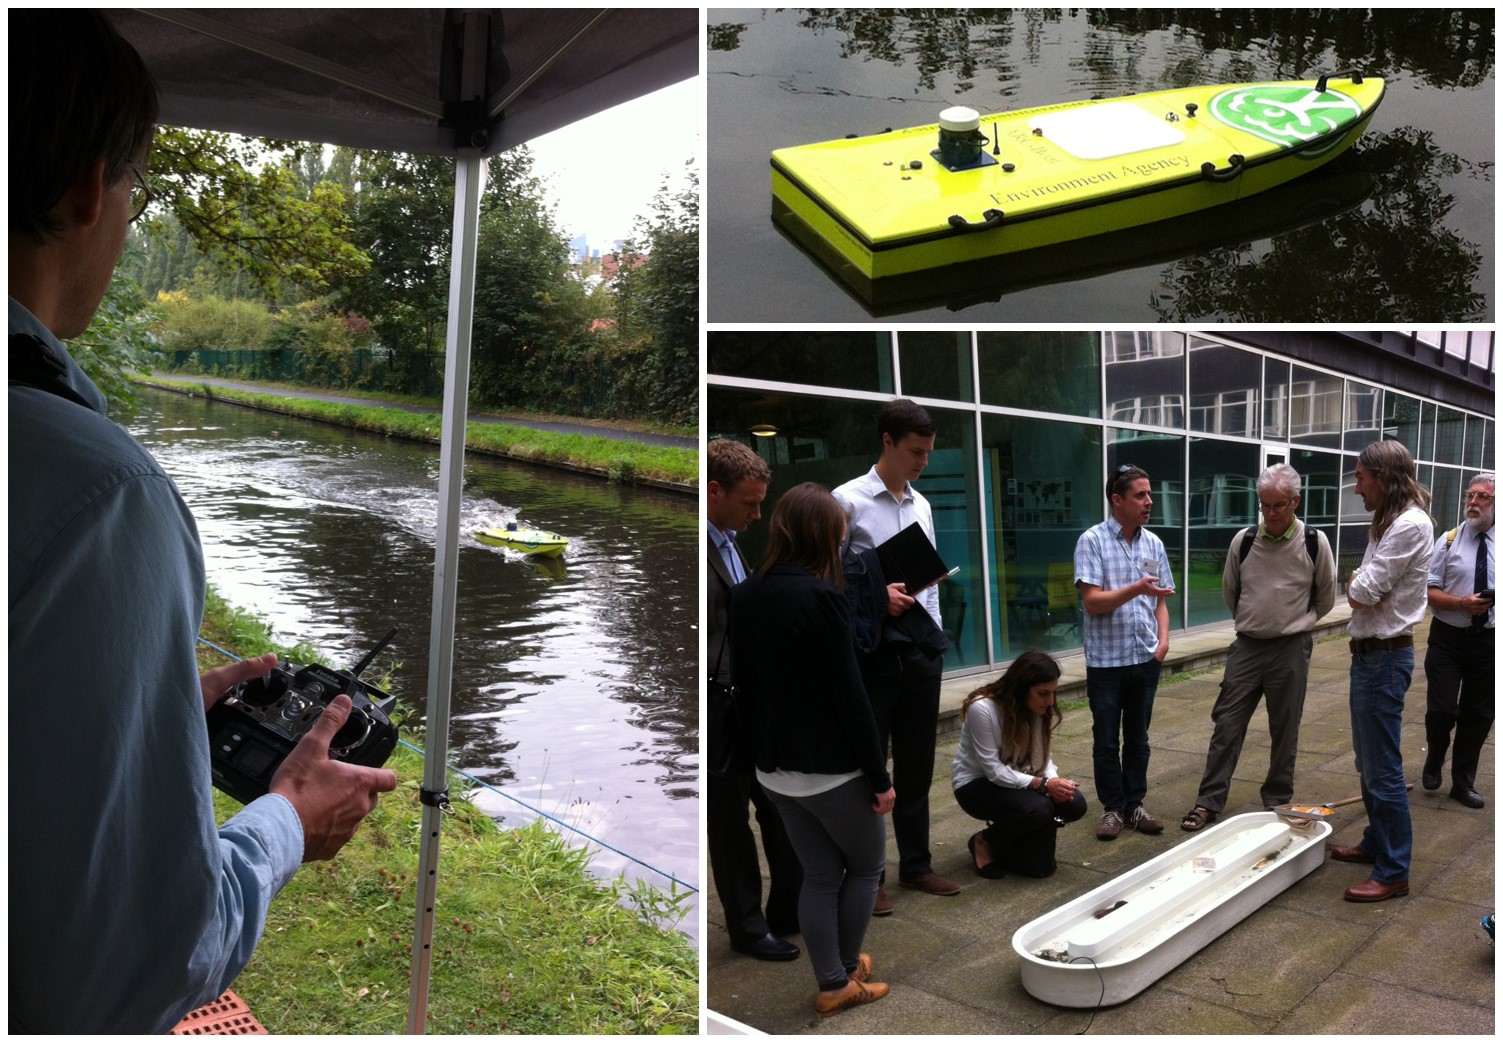
Conference delegates testing out the EA remote controlled ARC-boats for river gauging and learning about Birmingham Universitiy’s recirculation stream systems