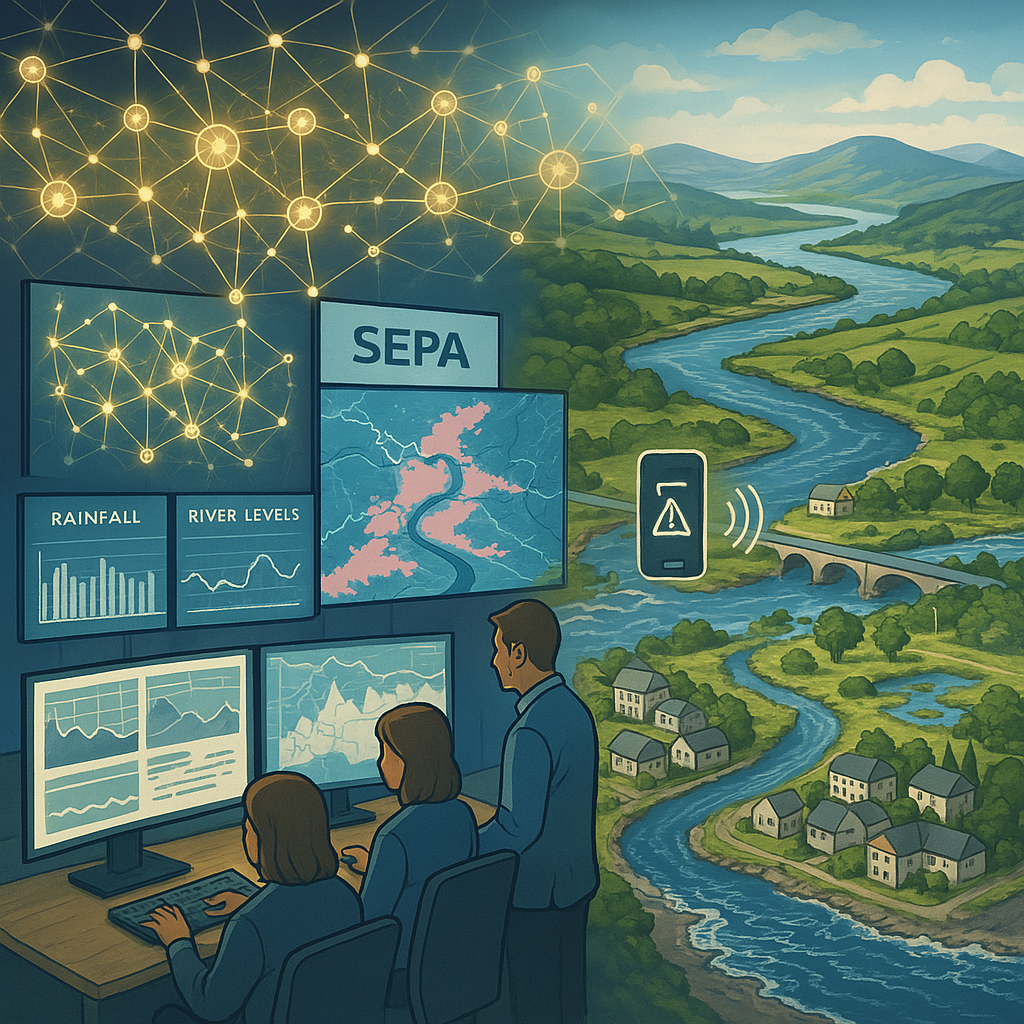
Our latest blog comes from the DelugeAI CREW project team (Christopher White, Douglas Bertram, Robert Atkinson, Muhammad Usman, Kamila Nieradzinska and Victoria Martí Barclay) at the University of Strathclyde on the exciting developments in the Artificial Intelligence space.
Can we harness Artificial Intelligence (AI) and Machine Learning (ML) to improve flood forecasting in Scotland? The short answer is yes. The longer answer is still yes, but there are many things to consider – from the data and resources available to the ethics, transparency, and staff training required to use AI responsibly. The DelugeAI project, delivered through CREW by researchers from the University of Strathclyde, recently carried out a rapid review of how AI/ML is being used in flood forecasting across the world, and what that could mean for Scotland.
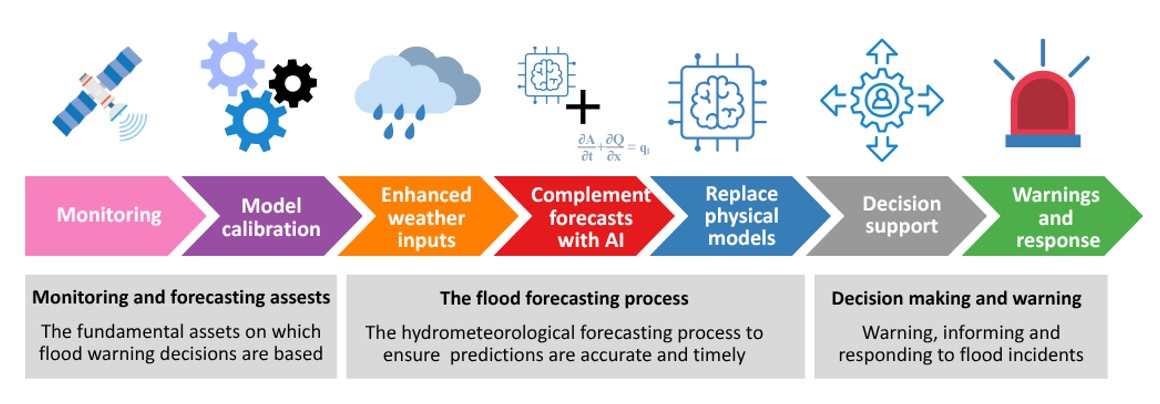
Working closely with SEPA, the team developed a framework that maps out the key stages of flood forecasting, from monitoring and model calibration to decision support and issuing warnings. This framework was used to guide the review, helping identify where most AI research and applications are currently focused, and where there are still gaps. It also allowed the team to consider how AI might be used to strengthen each part of the forecasting chain, rather than viewing it as a single tool for prediction.
Conceptual framework identifying seven flood forecasting phases where AI/ML can integrate with and/or enhance forecasting.
Globally, AI-based flood forecasting tools, such as Google’s Flood Hub, have already made a significant impact. Flood Hub provides forecasts in over 80 countries, including areas where forecasts did not previously reach, highlighting the huge potential of AI and ML. Closer to home, initiatives like FloodAI in Northumberland are developing a network of sensors for monitoring and early warning for rural communities in small catchment areas, areas where the traditional hydrodynamic models fall short. These real-world examples show how AI can fill critical gaps in flood forecasting.
“We haven’t yet fully grasped the potential of these technologies. Our existing research and operational ecosystems—encompassing models, infrastructure, and workflows—were designed for a different paradigm. In many ways, we’re like early humans confronted with a car: unfamiliar with driving or repairing it, accustomed only to walking. This analogy underscores the challenges we’re facing. The uneven progress in AI adoption often stems not from the technology itself but from our systems, expectations, and readiness to rethink long-standing assumptions.” Florian Pappenberger – Director General (elect) ECMWF
A key takeaway from the review is the importance of clearly defining the problem before selecting an AI tool, as different types of tasks require different approaches. For example, turning satellite images into flood maps is a spatial (2D image) problem, which can be tackled using convolutional neural networks (CNNs), as seen in recent work by NIWA in New Zealand. In contrast, using recent rainfall data to forecast future flooding is a time series problem, often addressed with models like Long Short-Term Memory (LSTM) networks, an approach used by AI4Flood. If the goal is to support decision-making based on structured inputs (such as thresholds or classification), tree-based models may be most effective. In more complex situations, the best solution may involve combining multiple machine learning models, each addressing a different part of the forecasting process.
After looking at the peer-reviewed academic literature, operational projects, and through discussions with experts, there was a clear consensus: AI and ML works best when used alongside traditional numerical models, not instead of them. This “hybrid” approach, where AI helps collate and interpret data, fill gaps, or speed up decision-making, is proving more effective and trusted than trying to replace traditional models. Additionally, hybrid models are increasingly favoured as they improve accuracy and speed but are still bound by physical models, which increases trust in the forecasts, a big concern around AI applications.
Building on the review, the team carried out a feasibility study for implementing AI/ML in SEPA’s flood forecasting framework and recommended a phased approach. Start with “quick win” applications, such as using open-access tools, piloting AI for early warnings, and supporting operational decision-making. Over time, SEPA can explore more complex uses, such as model calibration and monitoring in small catchments. Crucially, all AI/ML systems should be transparent, trustworthy, and supervised by human experts.
The project concluded that by investing in the right skills, building ethical frameworks, and choosing tools carefully, Scotland can take advantage of AI in a way that enhances the current approach to flood forecasting. AI and ML won’t replace expert judgement, but it can support it, helping increase flood resilience and keep people safe in a changing climate.
2025 marks ten years of our co-convened PICO session at the EGU General Assembly on operational forecasting and warning systems for natural hazards: innovations and challenges. It’s interesting to reflect on what topics were discussed in 2015 and the key topics are now. Clearly the use of AI and machine learning has become an emerging area of opportunity as well as making forecasts more meaningful for users through impact-based communication. All the abstracts and some of the presentations are available online, but here’s a summary of the session.
2025 EGU General Assembly attracting nearly 20,000 science abstracts
The session opened with a couple of talks on climate services – sub-seasonal to seasonal predictions. Chloe Hopling presented work under the Clare Programme, where remote sensing and machine learning techniques help the Kenyan Drought Management Authority prepare for water scarcity. Massimiliano Zappa, from WSL in Switzerland, covered approaches to combining modelling techniques across hydrology and including new AI-based models to also help drought forecasting and has also contributed to our DelugeAI rapid research on flood forecasting.
Tim Busker from Vrije Universiteit Amsterdam, compared transboundary early warning systems across Central Europe. Whilst forecasting approaches are advanced, the translation to impacts, warnings and actionable advice remains difficult. We had a good chat on the use of Common Alerting Protocol (CAP) as we push to integrate warnings from Scotland onto the MeteoAlarm platform and Google using CAP.
Maggie Henry Madsen presented some excellent work by the Danish Meteorological Institute. They have rapidly developed impact-based solutions and gave an example of coastal warning where they have developed a real-time mapping service for the entire coast of Denmark for 5 day mapped predictions of sea level and surge inundation. Work is also underway on river and surface water flooding and how they are working with responders to make this service effective.
As we saw from our work on the NERC Project Emerge with NVE and the University of Strathclyde, Trine Jahr Hegdahl covered work in Norway to improve local Decision Support. The work is focusing on four key needs of the user: early information on the risk; locally relevant information about the consequences; effective communication or a range of stakeholders; and easier documentation on the consequences and adaptation approaches.
The final presentations turned to the challenge and developments around hard to predict and extreme flash flooding. Timothy Hewson from ECMWF covered low probability forecasts of high impact events and the ECMWF ecPoint system. Tim showed how the system provides estimates of likely maximum rainfall, tailored for flash flood applications and the utility of these predictions even if probabilities are small. We are continuing the discussion to see where this could be of benefit to our flood forecasting service.
Charlie Pilling from the Flood Forecasting Centre gave the final talk before the interactive sessions. He presented on the development of a new Rapid Flood Guidance service for flash flooding in England and Wales as it moves into its second year of operation. This new service and product for flooding in the ‘nowcasting’ stage has been developed in partnership with the Expert Weather Hub at the Met Office and brings a new approach to communicating with responders during these challenge and rapidly developing convective spells.
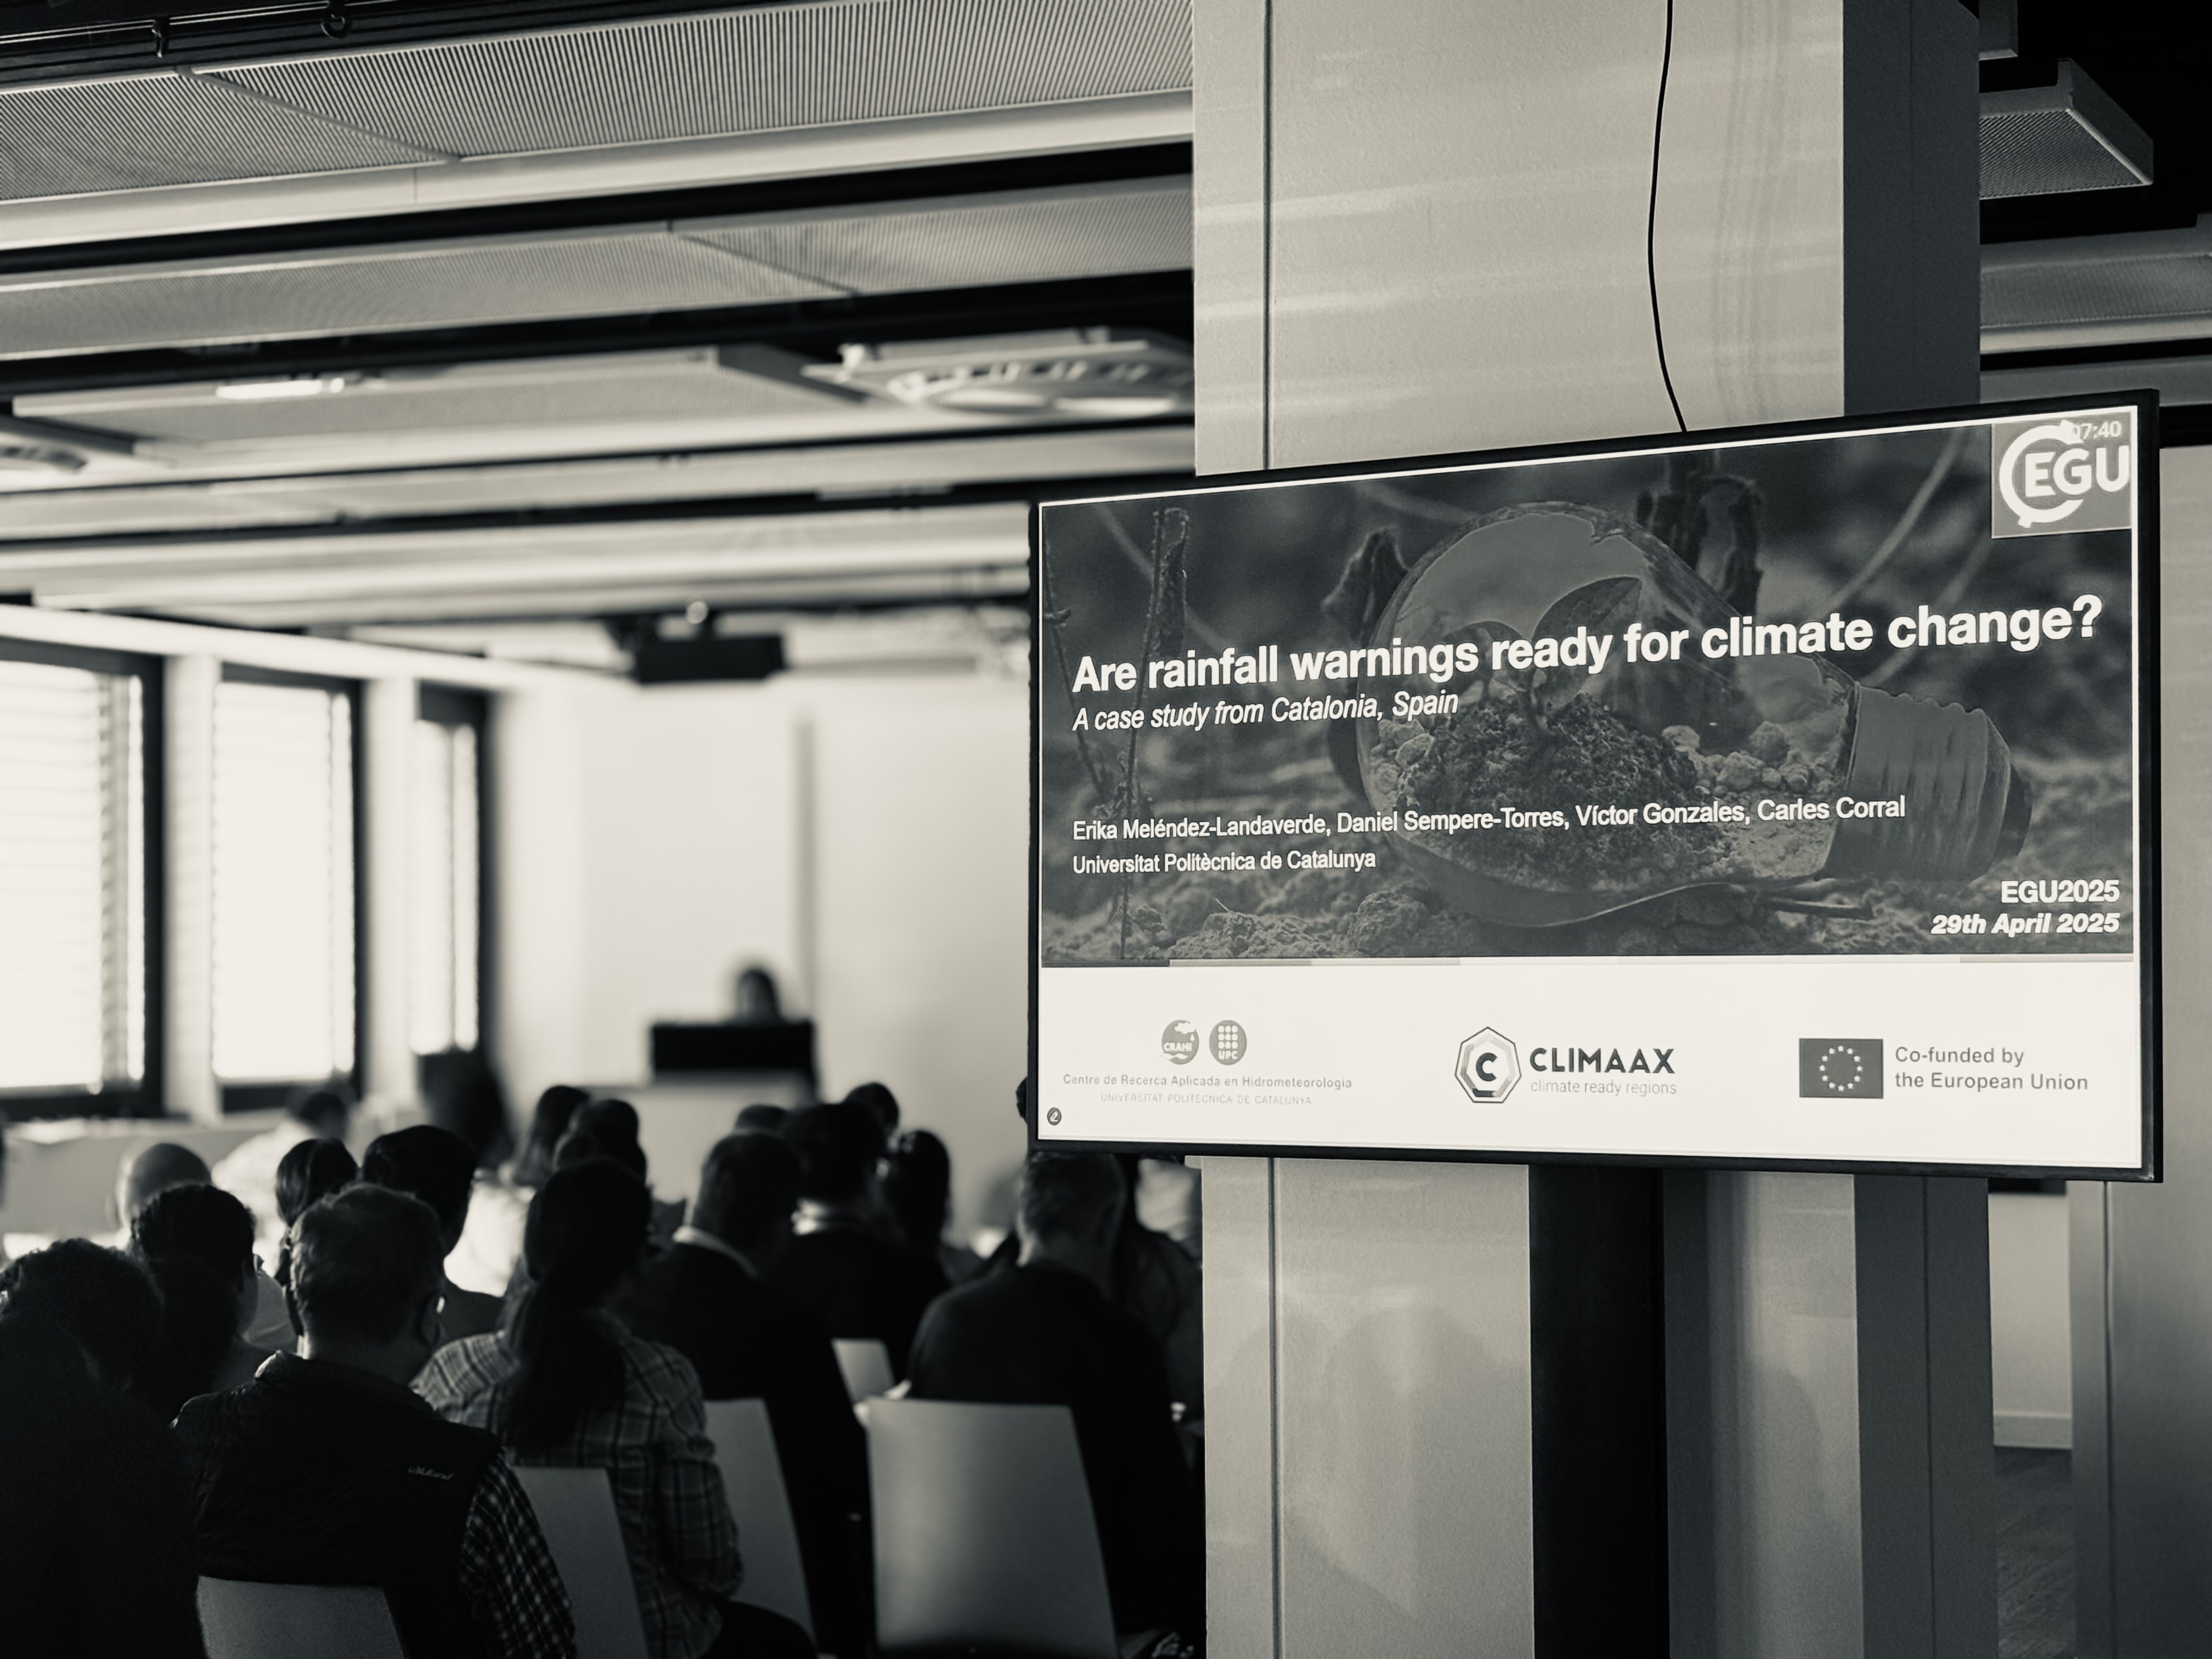
There’s so much other great science on show at the General Assembly beyond our session, however a quick plug to the work of Erika Melendez-Landaverde from the Universitat Politecnica de Catalunya. Using rainfall depth-duration predictions linked to impacts are common for many warning services. Recognising this and needing to consider how precipitation extremes will change in frequency and intensity with climate change, the work she presented and funded under an EU Horizon 2020 project, uses a framework to apply future scenarios and assess spatial variations in critical thresholds.
Jamie Rae, Senior Scientist with the flood forecasting service, explains the work that has been going into enhancing our surface water flood forecasting capabilities:
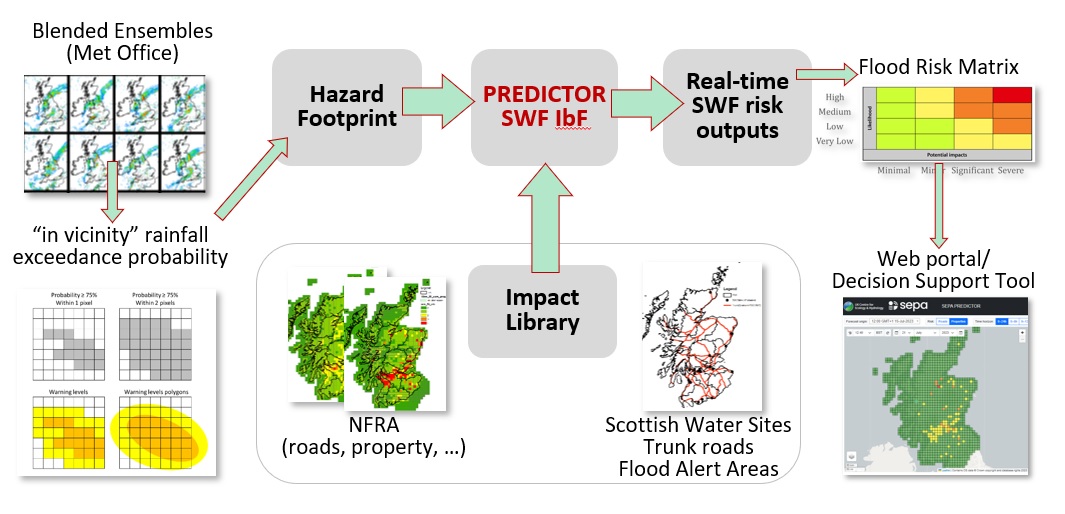
This tool, known as PREDICTOR (PREDICTing flooding impacts from cOnvective Rainfall), has now been developed in partnership with the UK Centre for Ecology and Hydrology (UKCEH), using the expertise of specialists in flood risk from SEPA, and experts in convective forecasting from the Met Office. PREDICTOR was adopted operationally by the forecasting service in April 2024.
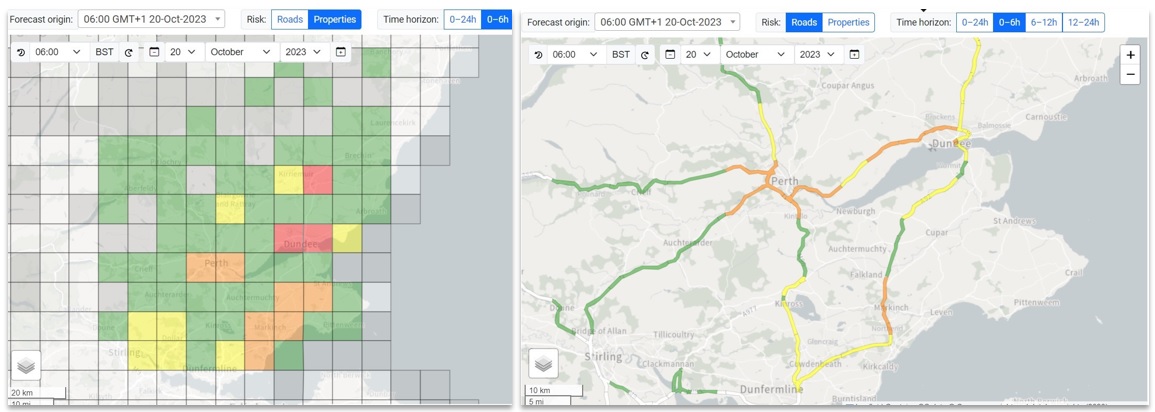
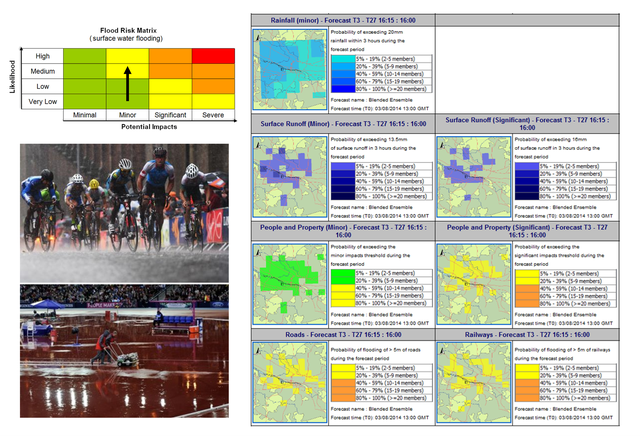
PREDICTOR visualises the surface water flood risk up to 24 hours ahead across Scotland on a grid of 10km x 10km squares. As in the Flood Guidance Statement, the flood risk is assessed via a risk matrix, based on a combination of impact and likelihood (see figure).
The flood risk matrix, showing how the overall risk is derived from the potential impacts (horizontal axis) and likelihood of those impacts occurring (vertical axis).
Forecasting Impacts
In PREDICTOR, the potential impact of surface water flooding is derived from forecast rainfall exceeding thresholds for minimal, minor, significant and severe impacts. However, whereas standard thresholds were previously used across Scotland (for example, 20 mm in 3 hours equating to minor impacts), the thresholds used in PREDICTOR vary according to location, and are derived from local vulnerabilities to surface water flooding, based on SEPA’s National Flood Risk Assessment 2 (NFRA2) for Scotland.
Likelihood of impacts (i.e. likelihood of rainfall exceeding the impact-based thresholds) is derived from Met Office ensemble rainfall forecasts. Ensemble forecasts involve running the forecast model multiple times, with slightly different starting conditions in each case, to represent the uncertainty in the conditions in the atmosphere, and how this manifests itself as uncertainty in the forecast outcomes. This allows us to forecast the probability, or likelihood, that a specific rainfall threshold will be exceeded in a particular location. In this case, there are 24 ensemble members – that is, the forecast model is run 24 times, with 24 different sets of starting conditions.
Schematic showing how the rainfall forecasts and vulnerability data are processed in PREDICTOR to produce the probabilistic impact-based forecasts for surface water. Source: UKCEH
Within PREDICTOR, the outputs from these forecast runs undergo what is known as “neighbourhood processing”, or “in-vicinity processing”, which accounts for the uncertainty in the location of forecast convective precipitation, by assuming that rain that is forecast to fall in a particular location could in reality fall in a nearby location instead.
Going Operational
PREDICTOR was developed in partnership with UKCEH in spring and early summer of 2023, and trialled by SEPA during the remainder of the summer of that year, before being adopted operationally the following April.
PREDICTOR Visualisation for Storm Babet. Risk of flooding impacts to property (left) and risk of flooding impacts to the Trunk Road network (right).
Used alongside existing tools, PREDICTOR now gives the flood forecaster a valuable insight into the potential risk of surface water flooding with a lead time of up to 24 hours, and enhances the capabilities of the Scottish Flood Forecasting Service in forecasting surface water flooding, as we work towards implementing the aims outlined in the Flood Warning Development Framework.
As previously reported, the NERC-funded EMERGE Project has brought together scientists, researchers and early warning specialists from across Iceland, Norway and Scotland including the Scottish Environment Protection Agency. Following successful exploratory workshops in Oslo (May 2022) and Glasgow (March 2023), it was the Icelandic Meteorological Office (Veðurstofa Íslands) who hosted the final project event during the week of the 8th to 11th May.
The Icelandic Meteorological Office (IMO) are responsible for monitoring, informing, forecasting and providing warnings for natural hazards. In no other country that the project has been exposed to, can you observe such challenges around extreme and multiple natural hazards including the impacts of volcanic ash and extreme flooding. As witnessed on a guided tour of the Svínafellsjökull glacier and surrounding area, there is a real feeling of living on the edge of potentially extreme hazards.
IMO warning service. These are issued using WMO Common Alerting Protocol standard and are impact-based for weather warnings.
The workshop was attended by staff and specialists from IMO, Iceland’s search and rescue team (ICE-SAR), University of Iceland, the Civil Protection Authority and the Icelandic national broadcasting authority, who were recording a podcast on natural hazards in the country.
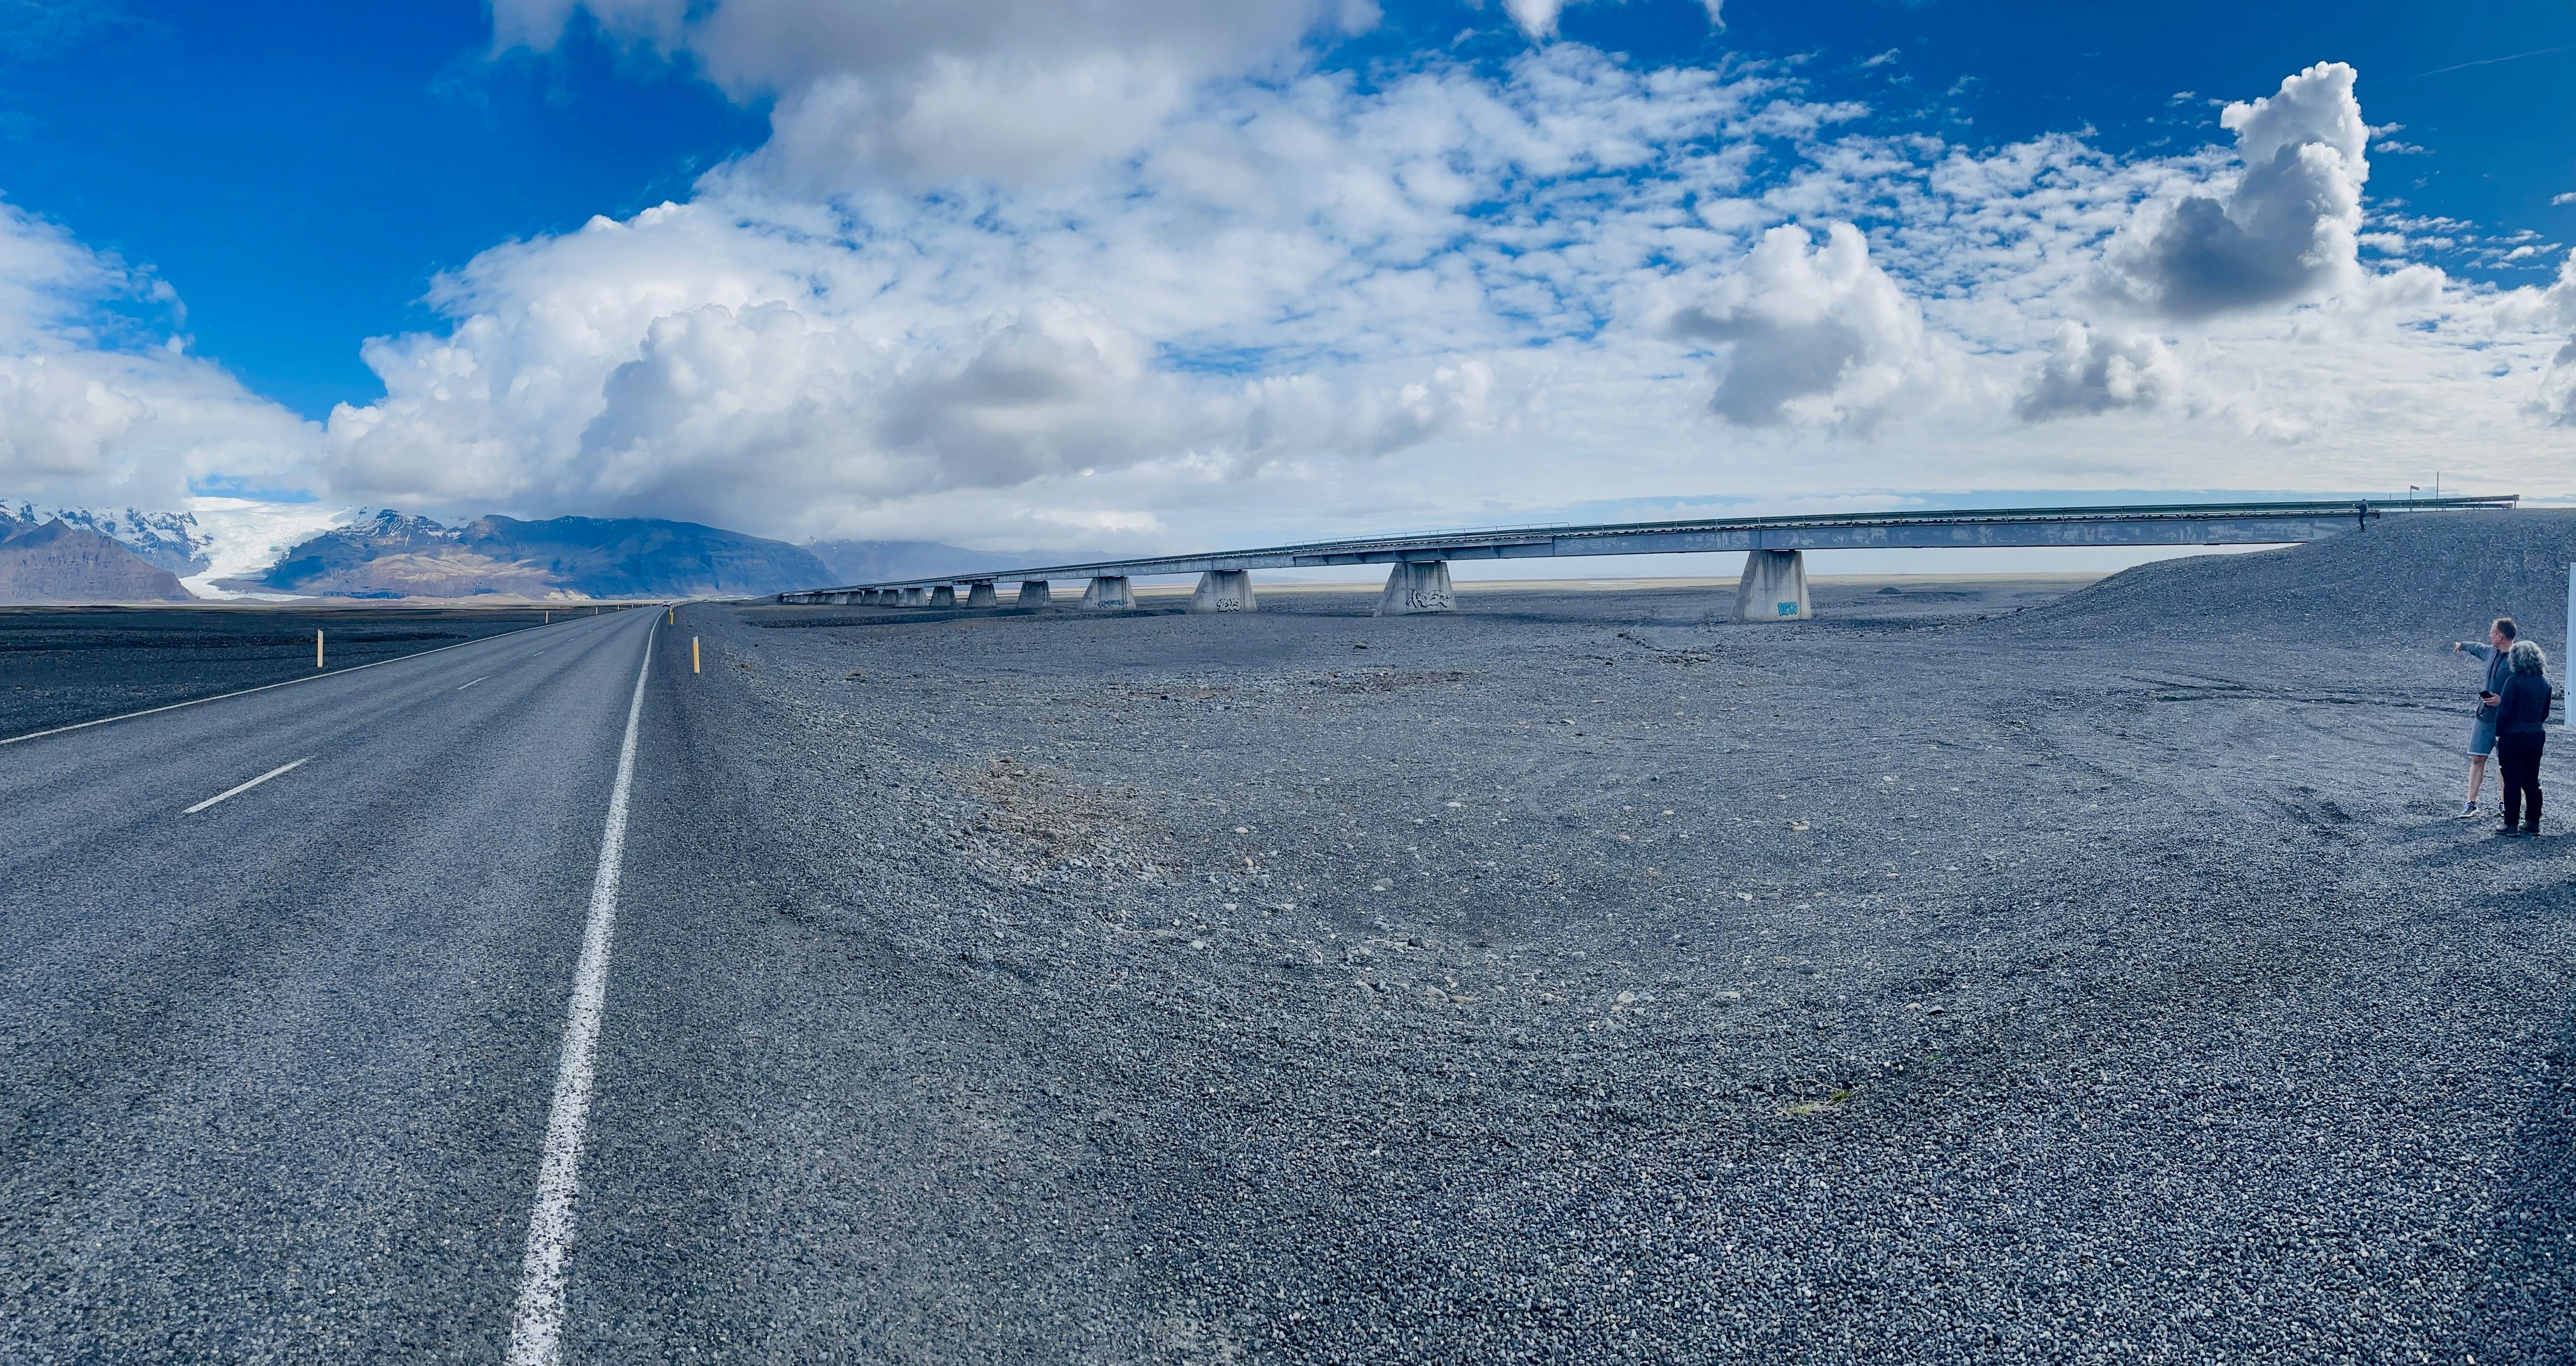
Iceland’s longest bridge Skeiðarárbrú which is now closed. During a massive outburst flood in 1996, the Skeiðarárbrú bridge was severely damaged by floating ice boulders, some the size of two-story houses.The river has now changed course and it was decided to abandon the single lane bridge.
As discussed, glacial floods (jökulhlaup) present the greatest risk to people in Iceland, with 1 to 3 per decade causing significant damage to bridges, roads and infrastructure. “Medium sized floods are those with a maximum discharge of several thousand cubic metres per second”, and, as illustrated by various speakers, the scale of the issue is being made greater, with mass tourism in the past decade increasing the risk exposure.
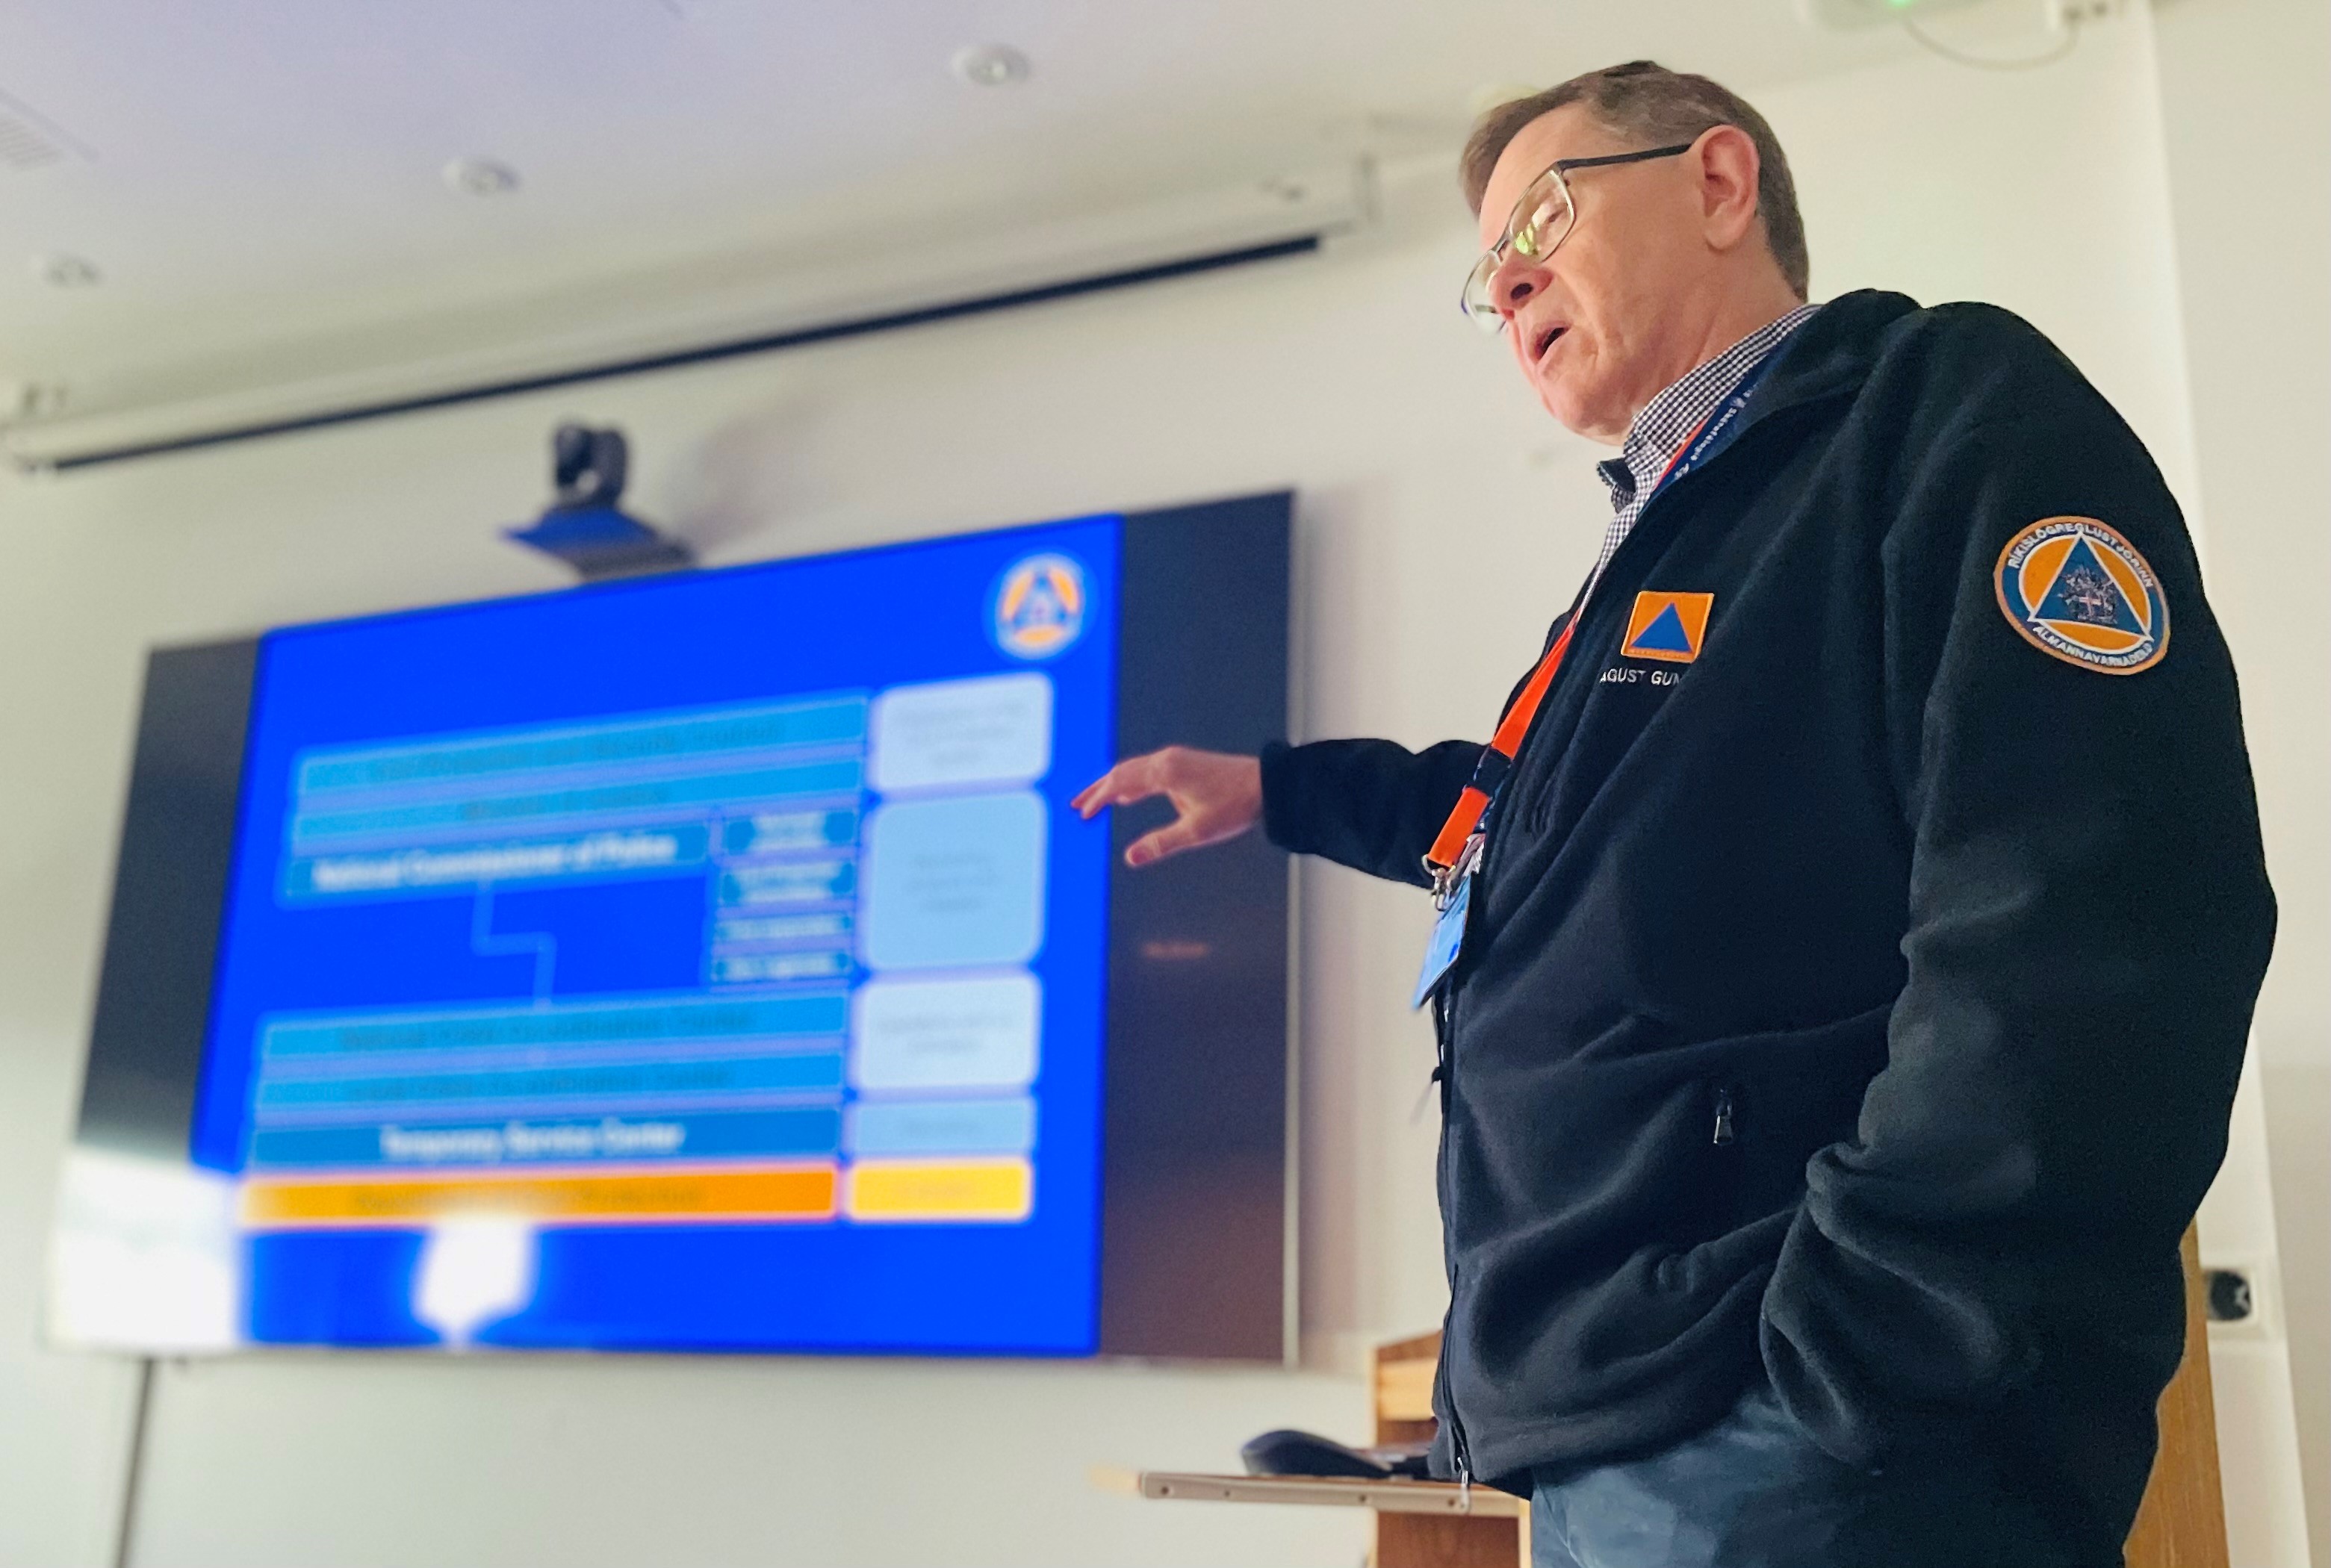
One point was made by both the IMO and the Civil Protection Authority (Almannavarnir), in that there is a fine balance between timely warnings, when you only have 45-60 minutes warning for a typical jökulhlaup, and false warnings… “always be open about communicating uncertainty” was the key message from the Almannavarnir representative Ágúst.
Ágúst Gunnar Gylfason presenting the work of Iceland’s Civil Protection Authority.
Reflecting on the common challenges and issues across the three countries, one question has been consistent… are these risks worse in remote regions given the lack of monitoring? Although all organisations are working towards improved observational networks where needed. Tourism, whilst not unique, is certainly a bigger challenge in Iceland and how to warn of immediate hazards with such a transient population. It’s interesting that the IMO have already embraced cell broadcasting as a regular form of communication given the recent Emergency Alerts trial in the UK. Also, whilst the use of the risk matrix is common across Iceland, Norway and Scotland, so is the challenge of ‘yellow fatigue’ and communicating uncertainty and low confidence events.
The EMERGE Project has developed successful collaboration and sharing of ideas, and is unique in focusing on remote regions and multiple hazards. There will be more to follow from the project, including a planned publication around project learning, including warning communication where at-risk customers have differing appetites for information and dealing with compound events.
In August this year, SEPA published its new Flood Warning Development Framework. The framework defines the direction of travel for flood forecasting and warning services in Scotland with the aims to maintain and improve existing, and deliver new, operational flood warning services; upgrade capabilities through development and innovation; and deliver enhanced digital communications and an engaged and customer focused service. So what does this Framework mean for surface water flood forecasting capabilities?
In previous articles (Quick as a Flash Part 1 and Part 2) we’ve commented on how science developments have supported new first guess forecasting tools to handle the uncertainty in predictions. Although, the development of such tools was only seen as the first step, at the time we said “if we are to truly get to grips with surface flooding, we are likely to need much better weather prediction models and many more alternative forecast scenarios to properly quantify the uncertainties. This will require substantially more super-computing capacity in the years ahead.”
Later developments have included the implementation of the UK’s first operational surface water flood forecasting system operating at a 24-hour lead time. The approach combined advances in the science of forecasting convective rainfall events in the Met Office with a new blended ensemble (MOGREPS-UK) and nowcast ensemble combined with the use of SEPA’s pluvial flood risk maps and made operational through the Grid-to-grid model within the FEWS platform.
As described, following the trial of this system “The lesson we learnt during the (Glasgow) Games is that the staffing requirements to operate such a service are high due to the need to continually monitor the forecast, given the variability between model runs, and the briefing requirements to help end users understand the uncertainty.”
As set out in the Framework, SEPA as part of our work with the Scottish Flood Forecasting Service, intend to develop new capabilities for surface water flood flooding for the public and infrastructure sectors such as transport. As referenced in the Framework, a recent Discovery report has set out a future road map for developing our approach to this challenge.
The Discovery report puts forward five recommendations. The first to ensure we have competent staff to enable confident decision making in uncertainty. Further recommendations propose coupled meteorological and hydrological approaches to forecasting, building on recent research towards improved surface water flood forecasts for Scotland. The report concludes that we should explore how we work in partnership with other agencies in supporting a climate resilient infrastructure and explores the topic of warning for surface water events. As suggested following the London floods of 2021, there could be justification for having stand-alone warning systems for pluvial flooding.
Following the Pitt review into the 2007 floods, the UK witnessed a step-change in hydrometeorological capabilities with significant advances in river and coastal forecasting. It’s not impossible to imagine that we now need a similar step-change in capabilities to ensure we are prepared for the future impacts of surface water flooding due to climate change.
The workshop was held at a time of growing concerns around water scarcity in Norway. Following a winter of between 30% and 50% of the typical precipitation and a spring with limited snowmelt runoff, many reservoirs are now very low. The result is a region-wide call for reduced water use and cascading hazards such as forest and grass fires in the south of the country.
The aim of EMERGE is to develop new long-term partnerships with international researchers to better understand the unique challenges natural hazards pose in remote settings in Iceland, Norway and Scotland; and there’s plenty all partners can learn from the Norwegian approach to multi-hazard early warning.
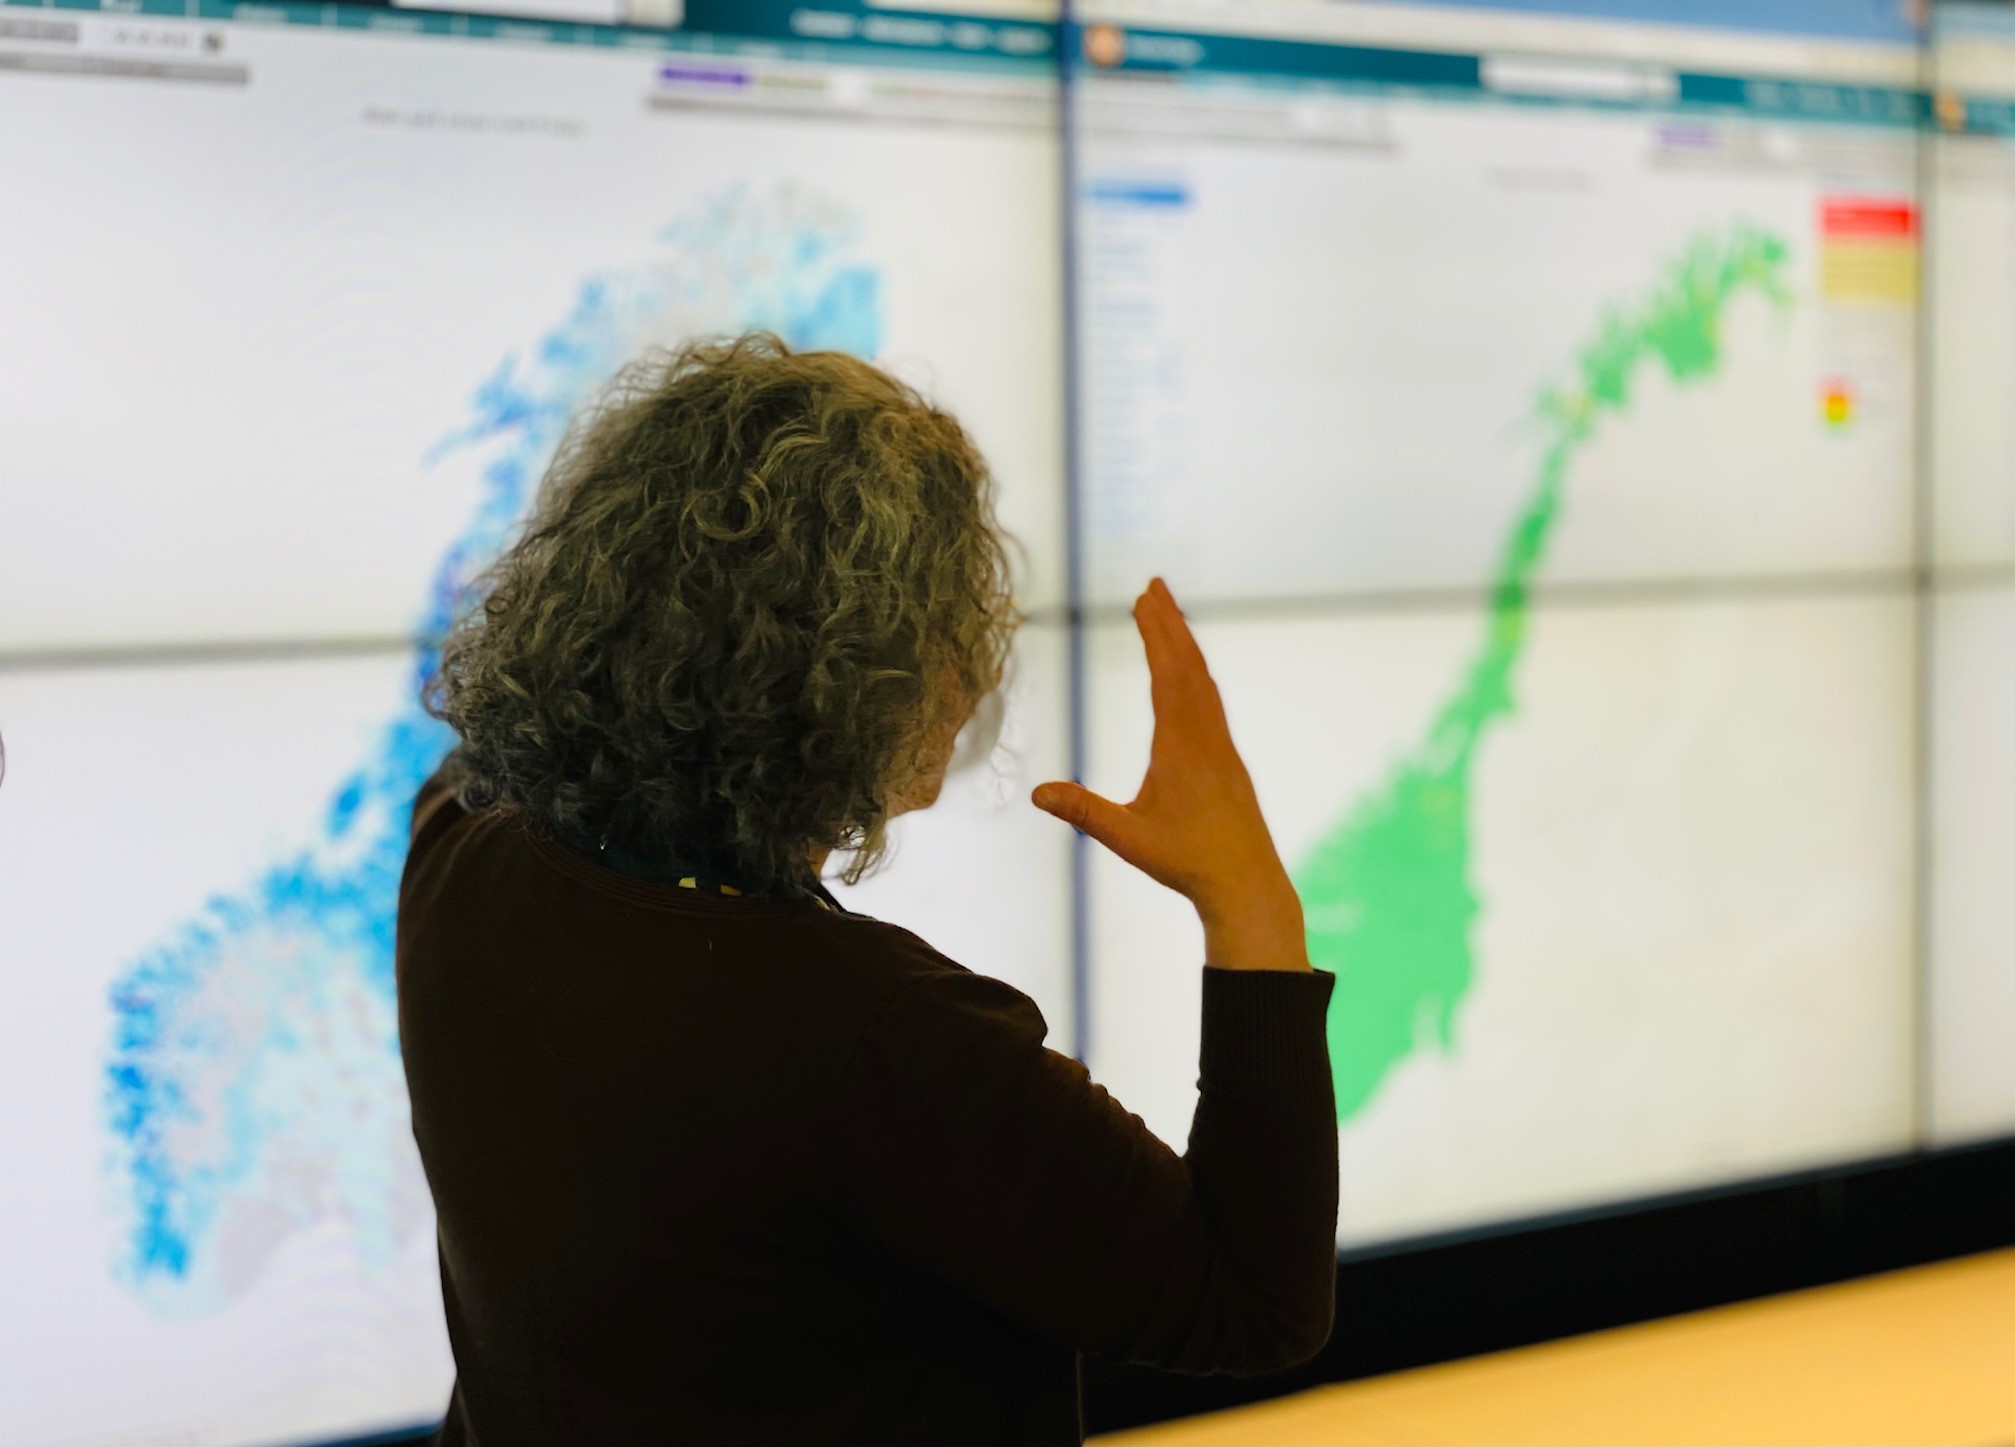
Varsom.no is a multi-hazard early warning system operated in Norway covering flood, landslides and avalanches, plus meteorological hazards wind, lightning and heavy rain.
NVE operate Varsom a trusted multi-hazard warning system providing national and regional warnings for flood, landslides and avalanches. The service is operated in partnership with the Norwegian Meteorological Institute. Whilst the public-facing service operates a simple escalating green-yellow-amber-red risk status, a lot of the challenges include yellow warning fatigue, with the warnings ‘operating more in log scale rather than linear’.
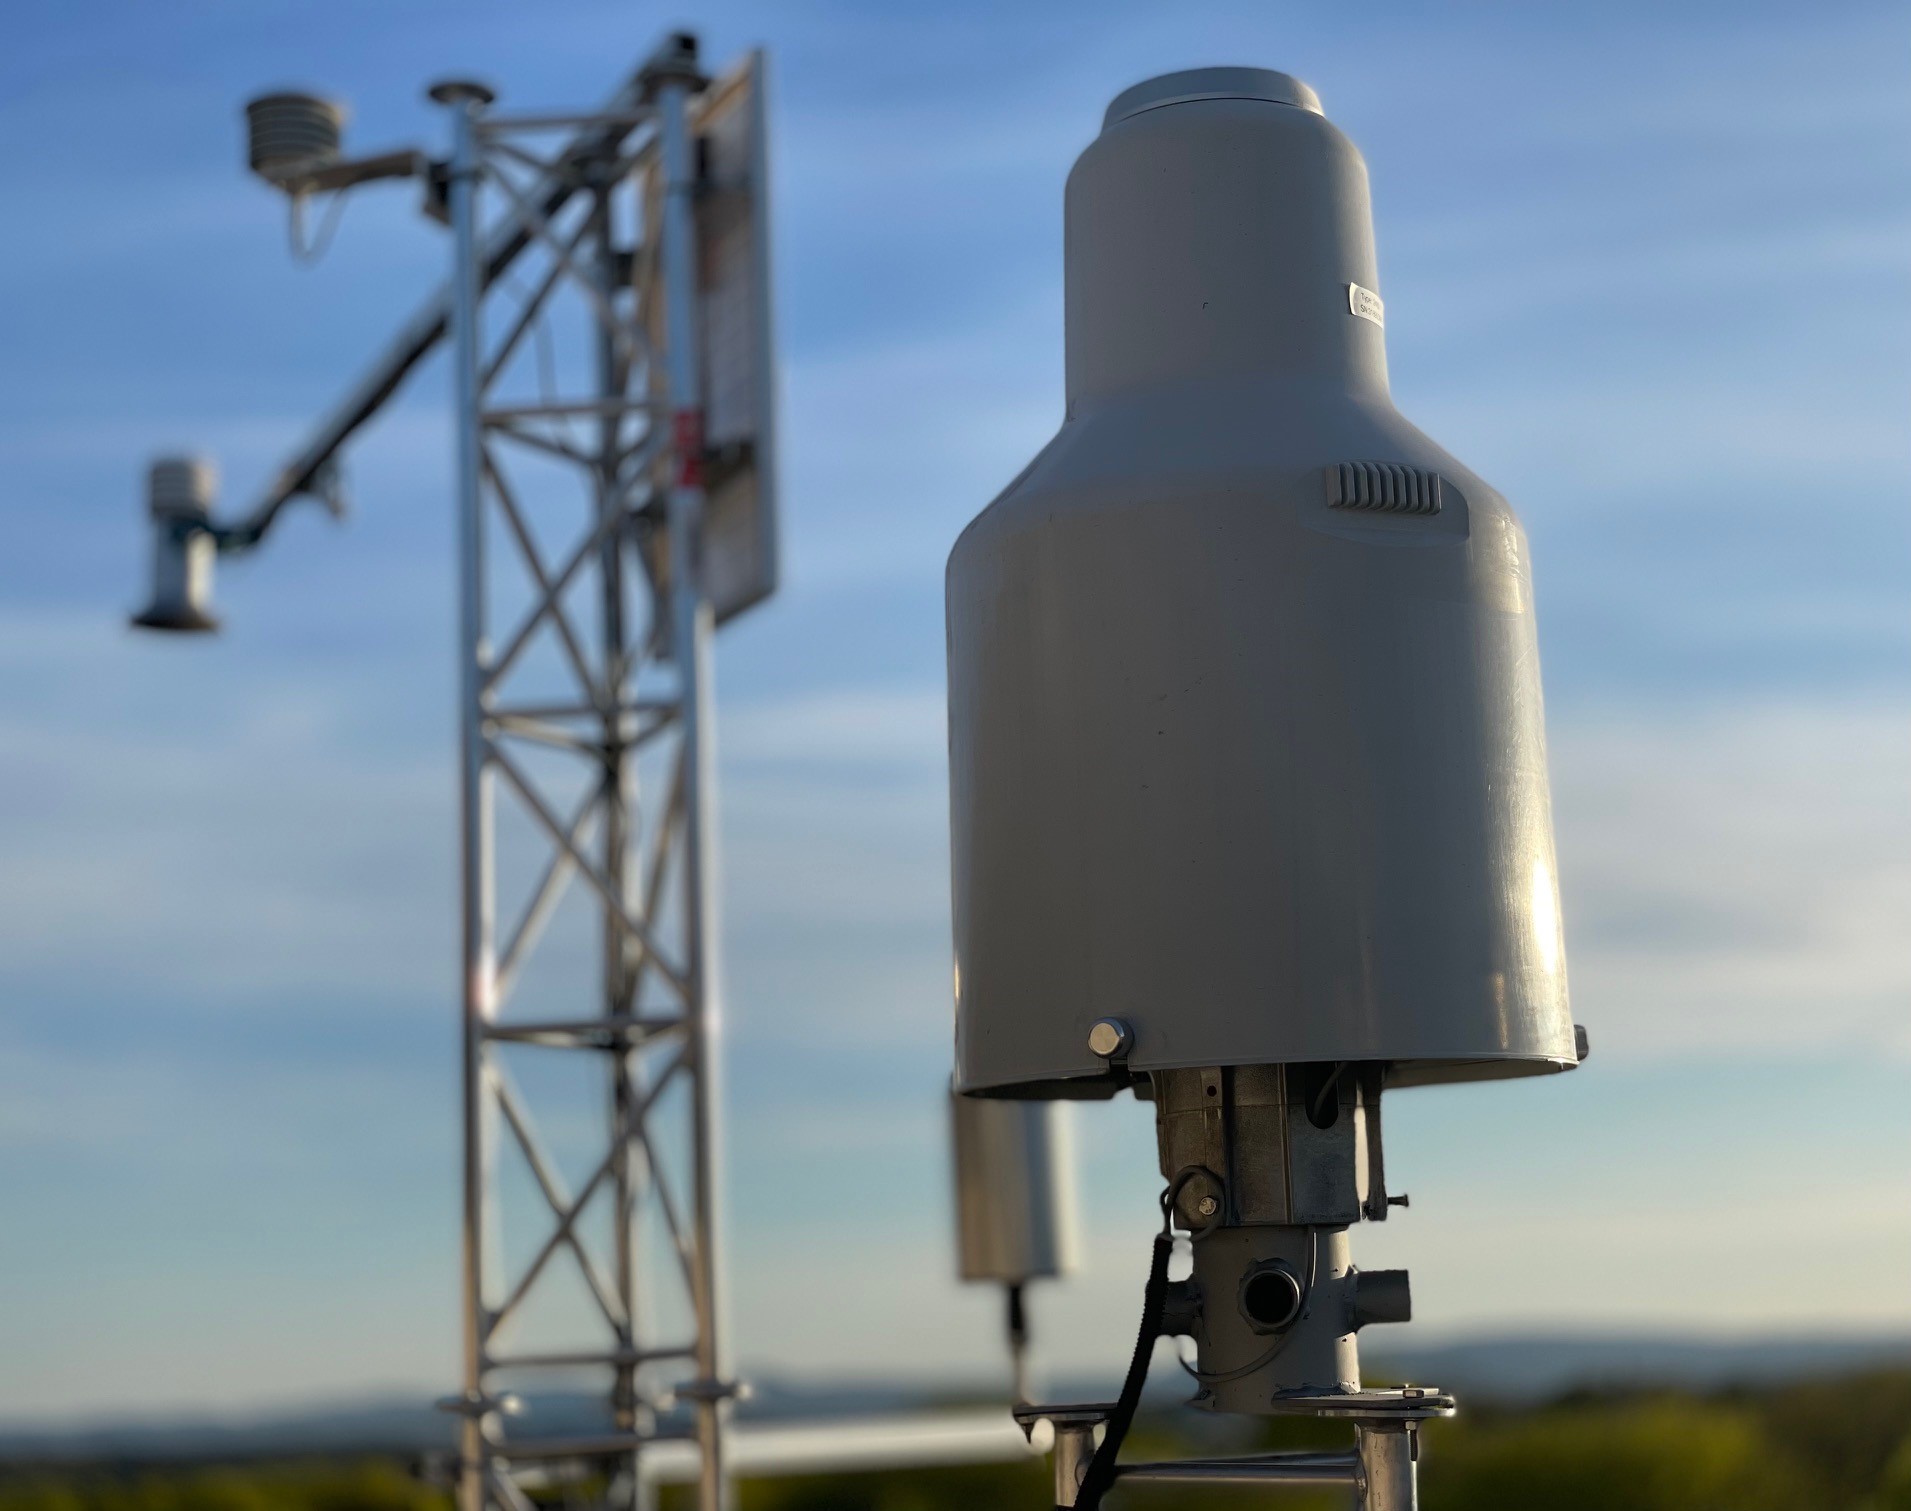
Rainfall and weather observations supporting hazard early warning systems in Norway
A key challenge for remote areas in Norway is the lack of observations supporting early warning systems. Similar to Scotland, Norway suffers from poor radar observations across the upland areas and limited spatial coverage of rainfall observations in remote and upland areas. To supplement this, NVE and the Met Institute use citizen science observations such as the NetAtmo network of independent rainfall observers and crowd-sourcing observations of hazards through the Regobs (Register Observations) application.
The operational centre for Varsom.no in NVE offices in Oslo
Operating a service that supports both urban and remote regions in Norway is also a challenge. With that, in 2022 NVE launched a four-year project FlomRisk is collaboration with Met Norway, the Norwegian Road Authority, the Directorate for Civil Protection and the Mapping Authority. The project aims to improve the flood warning system in Norway by testing the implementation of a flood impact-based warning system in five pilot municipalities, giving more precise, local and useful information.
Hervé Colleuille, Head of the Forecast of Flood and Landslide Hazards in NVE was keen to use the EMERGE project as a knowledge sharing platform, “We are particularly interested to learn from the flood warning system operating by SEPA in Scotland. Norway has quite close geological and meteorological conditions, the same amount of population for an area four times larger. The Scottish well-functioning flood warning system is a model and a source of inspiration for us in Norway.”
In the penultimate account in a series of articles on how the mountains of Scotland influence our approach to monitoring and flood forecasting, Mike Reading from the Met Office writes about the challenges of mountain forecasting.
“In Scotland, we face some very challenging upland environments for flood forecasting, as explained in this article. Forecasting for mountain regions follows a similar process to any other forecast. This starts by looking at observational data, then analysing the initial situation. Computational processes are then applied to create forecast values. Finally, a conclusion is drawn from all the available information.
Figure 1: The forecasting process
Observational data largely consists of measurements from weather stations, rain radar and satellite imagery. The analysis of observational data helps to verify model data and influences the final forecast. Observational data is also incorporated into computer models through a process called data assimilation, which acts to bring the model closer to reality at the start of each model run.
The meteorologist will take the available observational and model data and use these, along with their own experience, to create a forecast for precipitation accumulations in the mountains, whether this will be locked-up as snow or fall as rain, and whether there is likely to be melting of lying snow.
What are the challenges around forecasting in the mountains?
Figure 2: Mountain observation sites in Scotland
Accurate observational data is crucial to creating an accurate forecast. However, official weather observation stations in the mountains are rare, with only four in Scotland and one in England, and these stations only recording wind, temperature and dewpoint. This requires meteorologists to look at surrounding low-level observations then assess how they are likely to relate to conditions at higher altitudes, often a less than straightforward task. Rain radar is also less reliable in mountain regions as the topography often interferes with the radar beam. Algorithms attempt to mitigate against this to an extent by enhancing the rain radar signal over mountains to account for the effect of orographic uplift. However, these algorithms are not perfect and a lack of rain gauges in the mountains to verify rain radar means that there is always a degree of uncertainty over exactly how much precipitation is falling over the hills.
In addition to limited observational data, the complex terrain of mountains is impossible for models to recreate exactly. This is important because mountainous terrain will have a large impact on rainfall accumulations, enhancing it in some areas through orographic uplift and the Seeder-Feeder effect, and acting as a focus for thunderstorm development in the summer months. Other areas will experience much drier weather than they would otherwise experience in flat terrain. While all models will attempt to recreate these terrain effects, the extent to which they achieve this will depend largely on the model resolution.
Figure 3: Global Model orography compared with actual orography
Past upgrades to the Met Office supercomputer have vastly improved the accuracy with which the models represent the topography. The highest resolution operational model run by the Met Office, the UKV with a resolution of 1.5km, will usually do a good job of picking out areas of orographic enhancement, but even these high resolution models will fail to capture local features and the exact height of hills. This will result in the raw models often underestimating, and occasionally overestimating, precipitation accumulations in the mountains. Post processed model data can often do a better job than raw models due to taking into account local climatology and past observational data, but once again the sparsity of observations in the mountains limits the effectiveness of this post processing.
Figure 4: UKMO model rainfall rate over the Lake District. Left to right: raw global; raw UKV; post processed UKV; and rainfall radar all for the same time.
Another challenge that mountain environments pose to flood forecasting is snowmelt. While models have become much better at predicting whether precipitation will fall as rain, sleet or snow, what happens to snow after it reaches the ground is more challenging. In a mountain environment snow will rarely fall as an evenly distributed layer. Wind usually transports it resulting in relatively bare areas and deeper drifts where wind-blown snow has accumulated. In addition to this, the UK’s maritime climate often results in freeze-thaw processes that can transform loose powder snow into hard snow-ice. Both of these processes can make snow more resilient to melting. These factors are captured poorly, if at all, by the model, and need to be considered by the meteorologist.
One final challenge of mountain regions for flood forecasting is assessing how impactful any potential flooding will be. Due to orographic uplift, rainfall totals in mountainous regions are often considerably higher than in surrounding low-lying regions. Mountain regions tend to be far more resilient to these higher figures due to their sparse population and the frequency with which they experience high rainfall events. However, they will channel accumulations from across a large catchment area into a small number of watercourses at lower altitudes. The time period over which accumulations fall and how quickly this feeds into watercourses at lower levels must be considered. Wind direction also plays an important role; large rainfall events brought in by winds from an unusual direction can often be more impactful than those on prevailing winds.
Mike has been working for the Met Office for just over ten years as a forecaster, mostly based out of Scotland, and has worked alongside SEPA as part of the Scottish Flood Forecasting Service for over seven years. He’s a keen mountaineer with over twenty years experience of the Scottish Highlands and has built up a good level of local knowledge of the mountain environment in Scotland.
All of the above results in the mountains being one of the most difficult regions to forecast for. Despite huge advances in model performance over recent years, a considerable amount of experience and local knowledge remains crucial to providing accurate guidance when it comes to forecasting what impact mountainous regions may have on flood forecasting. The Met Office forecasting team at Aberdeen, part of the Scottish Flood Forecasting Service, has been creating mountain forecasts since the early 1980s. This has built up valuable experience in predicting mountain weather and, working alongside the forecasting hydrologist, now has a very important role in forecasting its potential to lead to impactful flooding.”
In this article, we take a retrospective view on a decade of challenges and achievements for the flood forecasting service with some of the many people who have made it a success. A period when Bertha, Ciara, Desmond, Dennis and Frank all became popular household names in the forecasting community, what a ten years it has been…
The first Flood Guidance Statement issued on the 9th March 2011
Following major flooding in 2007, the Pitt Review made recommendations for hydrological and meteorological forecasting services to come together to provide technical capabilities of forecasting, modelling and warning against all sources of flooding and increasing the preparation lead times for emergency responders. Whilst the Flood Forecasting Centre for England and Wales was established in 2009, other European Centres such as the national forecasting centre in France (SCHAPI) was held up as a good example to follow having developed a programme of forecasting service improvements such as the Vigicrues service – aimed at improving vigilance to flood risk.
Alan Motion (Former Head of Strategic Relationships for Devolved Administrations at the Met Office) explains the strategic drivers behind the service back in 2010: “To achieve an operational flood forecasting service in Scotland the first vital step was to bring key stakeholders on-board, especially within the prospective delivery partners and the relevant areas of Scottish Government. Gaining an understanding of the practicalities and politics involved was identified as a key factor even before we got to the drawing board. Reaching out to both national and international colleagues was vital to the success of that quest. The challenge then was in assessing the knowledge gained against the resources we felt may be available to us to support delivery of a science-led, largely user-defined, service for Scotland.”
As Alan says, establishing the service was at the time, “…full of challenges and the usual ups and downs such projects experience but very fulfilling.”
The virtual centre of expertise, building on existing operational teams at SEPA and the Met Office in Perth and Aberdeen, went live on the 9th March 2011. However, this was not without various challenges as Richard Maxey (SFFS Co-ordinator at SEPA) explains: “When I joined SEPA at the end of August 2010, apart from the concept and the agreement to resource and launch the service, there was very little actually in place. With the launch a mere six months away, we had to develop a Flood Guidance Statement, and work out how we would deliver it operationally …nothing will match the frenzy of activity that led to the initial launch of the service but by February 2011 we had a product and a process.”
Peter Buchanan demonstrating the flood forecasting service forecasting capabilities to the Environment Minister Stewart Stevenson
Collaboration has remained key to the success of the forecasting service. As Pete Buchanan (Former SFFS Co-ordinator at the Met Office) explains: “Working with multidisciplinary colleagues in the respective Met Office and SEPA organisations demonstrated how much could be achieved in a relatively short timescale. The commissioning and early consolidation of the SFFS provided an effective, efficient and often innovative approach to flood forecasting in Scotland.”
Underpinning the service with a science-led approach to forecasting across Scotland has been crucial, especially in the early stages when systems were limited. New coastal forecasting systems have been implemented and a Heavy Rainfall Alerting system to support surface water flooding introduced. One of the most significant achievements and game-changer for forecasting capabilities for the whole of Scotland was the introduction of the five-day countrywide river forecast. The approach was to couple high-resolution numerical weather prediction models with a 1km gridded hydrological model, to forecast the potential for flooding for the whole of Scotland. Richard explains: “These early days were accompanied by a rapid uptake of forecasting products, such as the Grid-to-Grid model and a rejigged daily weather forecast from the Met Office more suited to the new ways of working.”
Forecasts for countrywide 1km gridded hydrometeorological Grid-to-Grid (G2G) model with Qt grid to highlight the potential severity of flooding (left) and hydrological ensemble-based forecasts for the River Lossie at Sheriffmills in Moray (right).
Along with the science and system challenges, there were some very early operational challenges. The Dumfriesshire Floods of December 2013 was one of the first significant events, which resulted in an Amber Flood Guidance Statement. This was followed in 2014 by the remnants of ex-tropical storm Bertha that caused significant flooding across Morayshire. In both cases, the use of the hydro-meteorological modelling in G2G proved important in the early identification of the specific flood risks. The then Environment Minister, Paul Wheelhouse, commented following the Dumfriesshire flooding “I was extremely impressed by how well prepared all the authorities were – aided by the timely and accurate flood forecasts from the Scottish Flood Forecasting Service”.
Focusing on the impacts of flooding has increasingly been the focus of the daily decision making process, with the meteorologists and hydrologists always asking the question, how bad is it likely to be and where are the impacts. As a meteorologist for the service and former BBC weather reporter Peter Sloss explained in an article in 2014 … “(we have seen) a huge improvement with few surprises during the evolution of a weather event. Always fine-tuning the details of the weather forecast up to and during the event and communicating this message to all concerned. Also… the meteorologist is much more focussed on the impacts of the rainfall rather than just the amount of rain expected.”
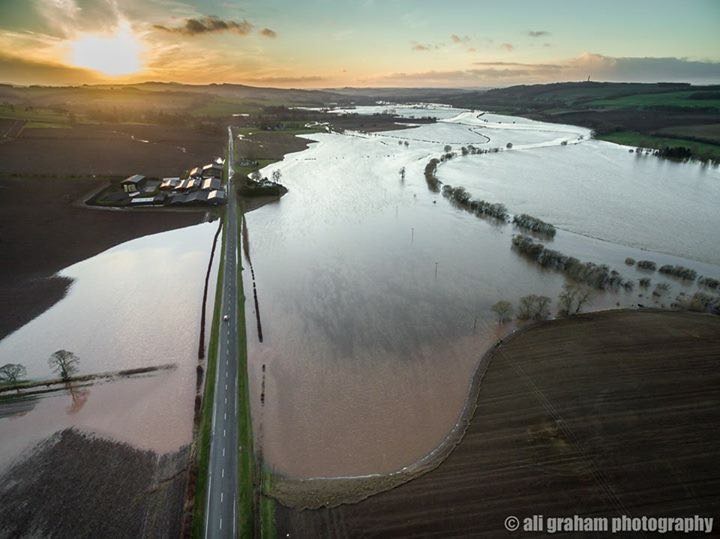
The River Teviot in Crailing in Roxburghshire recording its highest river level on a record spanning 55 years in December 2015. Copyright Ali Graham Photography.
During the ten years, there has been no greater flooding impact than during the winter of 2015 and 2016 with a succession of storms including Desmond and Frank. Storm Frank alone was severe with 101 Flood Warnings issued across Scotland, two Severe Flood Warnings and over 1,000 properties flooded. Karen MacDonald was a flood forecaster during this spell of flooding and recalls her experience: “Storm Frank was one of the first flood events that I was primary forecaster for. I had only been on the (forecasting) rota for 6 months so I was keen to get some weather to test my new skills but I remember seeing the forecast coming in and knew that this was an exceptionally big one! Across the country, most of Scotland’s major rivers were flooding so it was challenging to keep monitoring them all simultaneously.“
The first five years of the Guidance Statement
That winter of 2015/16 witnessed the issuing of the first Red Flood Guidance Statements and really tested the capabilities of the service. As Karen says: “Although this was an incredibly demanding flood event to deal with, I am glad that I was able to contribute to the response and am exceptionally proud of what we managed to achieve. Despite the widespread significant flood impacts, our Flood Guidance Statement and messages were able to provide the information to the responders on the ground that needed it to assist the public. That is why we do the work that we do, to help others and to make a difference. So as a new forecaster I was able to see first hand of the benefits that our service provides and appreciate the value of my new skill.”
As Karen says, improving the vigilance and preparedness to flood events has always been a primary aim of the service. Following Storm Frank, Mark Thomson, Principal Resilience Adviser at Dumfries and Galloway Council said, “It’s not just about the Forecasts/Alerts, it’s about the added value that the experts can offer when you want more detail regarding potentially vulnerable areas. It is fair to say that the SFFS outputs are the most important forecasts we receive on a daily basis, given the vulnerabilities we have! The key piece of information was … predicting record breaking levels on the Whitesands, that could exceed those experienced in 2009, 2013 and potentially as far back as 1982.”
As for forecasting science challenges, there is none greater than surface water and the ability to predict the timing, location and impacts of convective events. In the build up to the 2014 Commonwealth Games and understanding of the potential for disruption due to surface water flooding as seen in 2002, research was commissioned into how to develop a city-wide forecasting system. As Linda Speight (former SFFS Senior Hydrometeorologist) explains: “Developing the surface water flood forecasts for the Glasgow Commonwealth Games was an exciting opportunity to see what was possible with the emerging scientific capabilities for forecasting intense rainfall.”
FEWS Glasgow forecasts for afternoon of Sunday 3rd August 2014. Photographs show the conditions at the Games at this time. The risk level had been increased as we got closer to the event as the likelihood increased. There were reports of minor impacts across Glasgow over the weekend. (photo credit: www.eveningtimes.co.uk, www.sportsjournalists.co.uk )
“The conversations between decision makers, meteorologists, hydrologists and model developers gave us a unique perspective on balancing end user needs with science and practical limitations. It truly was a co-designed product. Involving everyone early on meant there was a shared understanding of the uncertainties in forecasting the timing and location of surface water flooding and hence realistic expectations of the output. Although there were still some interesting communication challenges for the SFFS during the Games!”
SFFS staff demonstrating service capabilities at a Science session at the Met Office in Exeter.
The global pandemic has provided challenges for many operational services. The forecasting service has had to adapt and work in different ways whilst still maintaining the critical role of providing the early forecasts and guidance to responders. As Jess Pryer (SFFS Co-ordinator at the Met Office) says: “The last twelve months have been a testing period for the Scottish Flood Forecasting Service, however despite this, neither organisation has stood still and we have embraced the challenges of COVID restrictions, exploiting technology and adapting our working practices a lot more quickly than we may have done.”
Cordelia Menmuir (SEPA’s Flood Forecasting and Warning Manager) recognises the significant importance of the forecasting staff that drive the service: “At SEPA we have always maintained that it is our knowledgeable staff, their experience and commitment to do the best they can to protect the people of Scotland that underpins the Flood Forecasting Service. Never has this been more apparent than over the last 12 months.I am immensely proud of what has been achieved. If we are to be ready to face the next challenge that gets thrown in our direction it is essential that we learn from our experiences and continue to build back better and stronger than before.”
Breach of the Union Canal resulting in water from the canal to spread across neighbouring fields causing floodingof the Edinburgh to Glasgow rail line following extreme rainfall in August 2020. Source: Scottish Canals
Likewise, Jess reflects on what we have experienced: “I want to learn and build on these changes going forward to help the partnership evolve, collaborating more effectively in the future using each organisations expertise to develop and improve flood forecasting for Scotland.”
So what may the next decade bring? One of the main science priorities remains addressing the ‘Grand Challenges‘ of surface water flood forecasting with work progressing to develop this capability further. We witnessed some extreme rainfall in August 2020 that acts as a stark reminder of the potentially devastating impacts of these types of events under a changing climate. We are also expanding the reach of the forecasting service as a new 3-day flood forecast product is set to launch later in 2021 to the public, a big leap from the partner-only service currently provided.
Author acknowledgements – huge thanks to everyone that has contributed and supported the service over the past decade. A selection – of the many – words from a handful of people involved have been used in the article but appreciate there are so many others that have made the service a success- many thanks to you all!
In the second of a series of articles on how the mountains of Scotland influence our approach to monitoring and flood forecasting, Dr. Andrew Black writes about the role of hydrometric observations.
Figure 1. The River Feshie peak flow of 18 December 2018 is ranked 2nd equal in the Feshie Bridge gauged record commencing 1992. The water on the rising hydrograph was visibly filled with ice and resembled a drink of coke! Photo: Julian Scott
“Continually rising global temperatures over the coming century might easily be associated with a lessening in the importance of snowmelt in many parts of the world. However, the ‘Beast from the East’ of 2018 and the wintry conditions as I write this in early 2021 show that snow and its subsequent melt very much remain part of Scottish climate for the time being, especially in mountain and upland landscapes, from where Scotland’s largest river systems flow. It is not uncommon for large floods in Scottish rivers to be caused partly by snowmelt (Figure 1).
This article seeks to examine the potential benefits and pitfalls of using tipping bucket rain gauge (TBR) data from higher elevations for flood forecasting purposes during snowy conditions.
Observations during snowfall
Observations may be direct or indirect. The most direct observations can be obtained from instruments designed specifically for monitoring snow water equivalent or snow pack depth (Figure 2). Weighing gauges and acoustic distance measuring equipment is relatively rare and, even when they are available, they provide information only for one particular point, and may reflect local influences such as aspect combined with snow blow after initial snowfall. Webcams such as those hosted by Traffic Scotland and Winterhighland provide visual assessments which can be useful for assessing conditions, especially the former which include infrared capability for night-time.
Figure 2. Instruments for monitoring lying snow: (left) SEPA’s Snow Scale with adjacent Ott Pluvio2 at Cairngorm Mountain (right) acoustic distance sensor being used for snow depth measurement
By way of indirect observations of snowfall, TBRs are more commonly available, so there are advantages in terms of geographical coverage, but users of the data from these gauges must beware of possible problems arising from under-catch and the timing of melt. A helpful early sign of snowfall is the occurrence of rainfall at low altitudes while adjacent higher-altitude TBRs record minimal or zero precipitation. Reliable air temperature data helps in interpretation. A good example is shown in Figure 3: intense rainfall at low elevation was confirmed by eye-witnesses, while adjacent gauges on higher ground registered no tips.
Figure 3. Time series of TBR accumulations in the Feshie catchment allow differences between low and high-elevation sites to be identified and snowmelt anticipated. A rainfall of 41.8 mm over 10 hours on 15/12/2018 at low elevation without corresponding receipts being recorded at higher elevation pointed in real time to the possibility of substantial accumulations of snow, and duly led to substantial melt on the morning of 18/12/2018
Observations during melt events
Problems may arise with use of TBR data during snowmelt events owing to possible under-catch of snow, due to aerodynamic effects and also the timing of recorded gauge tips. However, some gauges may provide an insight into imminent high runoff on at least some occasions. The same Feshie snowmelt event of December 2018 is illustrated in Figure 4 showing the lag between TBR accumulations at a range of elevations from 260 – 900 m OD and river levels at a similarly wide range of elevations.
While it may be interesting to examine the lag time in various ways between TBR accumulations and river level responses, one gauge in Figure 4 stands out – an ARG100 gauge at 520 m which was situated on the east side of a small hummock in the lee of prevailing winds – not normally best practice for gauge siting (and since decommissioned). This gauge began to record at the same time as other gauges, but had recorded 33.2 mm in the first 12 hours of the event, by which time none of the other 5 gauges had recorded more than 9.2 mm. Similar tendencies are found in other snowmelt events, suggesting the 520 m gauge may be able to offer some ability to indicate the onset of a major snowmelt event: the gauge possibly benefits from being especially exposed, allowing faster melt than in other gauges, while also giving a crude indication of the amount of snow in the catchment.
Figure 4. TBR accumulations and river level response, Feshie catchment, 17-19 December 2018.
It must be more typical to regard protruding rain gauges as a problem leading to under-recording of snowfall amounts and unduly early recording of melt compared with the majority of the snowpack. Figure 5 illustrates a set of gauges in melting snow at the Talla gauge comparison site at 425 m OD. At the time of the visit, none of the above-ground gauges contained any snow, save for the gauge buried in the pit, with its rim at ground level. The above-ground gauges clearly provided a misleading characterisation of the melt process – of course, the gauges are rain gauges not snowmelt gauges.
Figure 5. Preferential melt through TBRs at the Talla Water gauge comparison site: above-ground SBS500, Casella and ARG100 gauges have lost all their funnel snow to melt, while the snow pack above a pit-installed ARG100 remains in-tact (snow partially cleared for the photo).
Andrew is a Reader in Hydrology at the University of Dundee. He is a hydrologist with 30 years experience, mostly in Scotland’s rivers. Having started his career looking at statistical methods for estimating flood risks he has more recently developed expertise and strong interests in applying field measurement techniques to address important questions in hydrology.
Concluding remarks
The Feshie network of TBRs captures data from an unusually large range of altitudes, from 260 – 900 m OD, and provides an abundance of data with which to examine snowmelt events. This brief review illustrates how, by extending from the valley bottom up to some of the highest ground, it is possible to obtain a much fuller, if inevitably imperfect, portrayal of snow-related fluxes from the Cairngorms, which would be of value to a flood forecasting duty officer.
TBRs protruding above the ground surface may be unrepresentative of the general timing of melt in a snowpack, but might on some occasions be of value in giving early warning and an approximate snow water equivalent for an imminent snowmelt flood.”
Acknowledgements
Research sponsors and collaborators at Wildland Limited, Cairngorm Gliding Club, Borders Forest Trust, Newcastle University/Environmental Measurements Ltd and Michael Pollock.
In the first of a series of articles on how the mountains of Scotland influence our approach to monitoring and flood forecasting, Mike Kendon writes about their role on rainfall.
“Much of Scotland’s landscape is dominated by its mountains. Although relatively modest in height, reaching typically around 1000 metres in elevation, they nevertheless have a dramatic influence on rainfall.
Mike Kendon is a climate information scientist at the Met Office National Climate Information Centre. He studied an MSc in Hydrology at Imperial College, London and joined the Met Office in 2009. He helps develop and maintain systems to monitor the UK’s climate based on observations from the surface network of weather stations, and is the lead author for the Met Office’s annual state of the UK Climate reports (Kendon et al., 2020)
Due to its northerly latitude, Scotland is located close to the North Atlantic jet stream and therefore lies in the path of low pressure systems and associated rain-bearing fronts. As the westerly airflow is forced to rise over this barrier, low-level clouds are formed over the mountains. When precipitation from higher level ‘seeder’ clouds fall through the lower level ‘feeder’ cloud, the droplets collide and coalesce. This mechanism, known as the ‘seeder-feeder’ effect, is responsible for greatly enhanced orographic precipitation.
As a consequence, the West Highlands receive rainfall in abundance. Annual average rainfall may exceed 3500mm per year, and there may be a ‘day of rain’ (exceeding 1mm) on average almost two days out of every three. However, this orographic effect is highly localised and rainfall rapidly diminishes from west to east across Scotland, so much so that parts of the east coast (such as Angus, Fife and East Lothian) receive less than 700mm – a five-fold reduction – and these areas are among the driest parts of the UK (figure 1).
Figure 1: Annual average rainfall for Scotland based on the period 1981-2010 (source: HadUK-Grid 1km resolution dataset, Hollis et al. 2019)
Scotland’s rainfall is not evenly distributed through the year. The wettest months are from October to March, associated with the normal seasonal southerly shift in the Atlantic storm track – and it is not uncommon for 50mm to fall widely across the West Highlands in a day – locally totals sometimes exceed 100mm. The driest and more settled months tend to occur in late spring and early summer.
The seasonal influence on rainfall tends to reduce moving eastward, as this area increasingly falls within the rain-shadow of the mountains. In eastern Scotland, there may be a greater proportion of convective, rather than frontal rainfall, and rainfall totals on the east coast are more evenly distributed through the year. Figure 2 shows monthly average rainfall totals moving west to east – Glendessary, West Highlands (annual average 3508mm), Gairlochy, in the Great Glen (2168mm), Dalwhinnie, Central Highlands (1304mm), Braemar, Grampians (932mm) and Inverbervie, east coast (683mm).
Figure 2: Monthly 1981-2010 long term average rainfall for five Scottish stations.
The broad west-east contrast shows the most obvious influence of Scotland’s mountains on rainfall, but in reality the picture is much more complex. For example, in an easterly airstream the pattern may be reversed, with the wettest weather across the Grampians and the West Highlands falling into the rain-shadow. Scotland’s complex coastline also influences its rainfall patterns; for example coastal fringes of the West Highlands and Islands may be much drier than mountainous areas a few miles inland. Across upland areas, much of the precipitation falls as snow during the winter months, and lying snow often lasts well into the summer months. Over the mountain summits, snow may fall (if not lie) at almost any time of year.
Understanding Scotland’s rainfall distribution is important for many sectors – e.g. water resources, flood risk management – agriculture, ecology and hydro-power. A network of several hundred rain-gauges across the country provides data to help us monitor rainfall across Scotland, and understand trends, variability and extremes. Annual precipitation is, in general, dominated by a large annual variability about a relatively stable long-term mean, but with an increase in the latest few decades (Figure 3). Understanding these patterns in rainfall and how these may be changing as our climate changes, remains an important area of ongoing research for the Met Office and other research institutions. But for Scotland in particular, what makes monitoring precipitation so fascinating is the complexity of the climate across relatively short distances, and this complexity is in large part due to the influence of the mountains.”
Figure 3: Annual rainfall for Scotland, 1862 to 2019 (source: HadUK-Grid 1km resolution dataset, Hollis et al. 2019)
References
Hollis, D, McCarthy, MP, Kendon, M, Legg, T, Simpson, I. HadUK‐Grid—A new UK dataset of gridded climate observations. Geosci Data J. 2019; 6: 151– 159. https://doi.org/10.1002/gdj3.78
Kendon, M., McCarthy, M., Jevrejeva, S., Matthews, A., Sparks, T. and Garforth, J. (2020), State of the UK Climate 2019. Int J Climatol, 40: 1-69. https://doi.org/10.1002/joc.6726