
In a previous post we discussed what lessons should be learned from the winter storms of 2013-14 and how any recommendations should be taken forward and developed in the future. In Scotland, forecasting waves is a relatively new endeavour and the recent events in the Decembers of 2012 and 2013 as well as January 2014 highlight that more has to be done in developing this aspect in future flood forecasting projects in other areas of Scotland. As we approach the peak of the 18.6yr tidal cycle late in 2014 and throughout 2015, coastal flooding has rarely had a higher or more intense focus than at present.
The Moray Firth Flood Forecasting System is the largest coastal flood forecasting project ever undertaken in Scotland, covering in excess of 500 miles of coastline from Wick in the north to Fraserburgh in the north-east. In December 2012 and again in December 2013, numerous communities along the Moray Firth coastline were victims of two differing types of flooding; wave overtopping and tidal surge, highlighting the region’s vulnerability to coastal flooding from multiple sources.
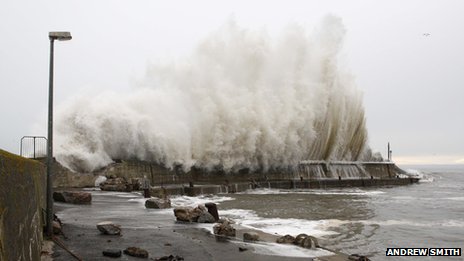
Waves overtopping the harbour wall at Portmahomack during December 2012 storm.
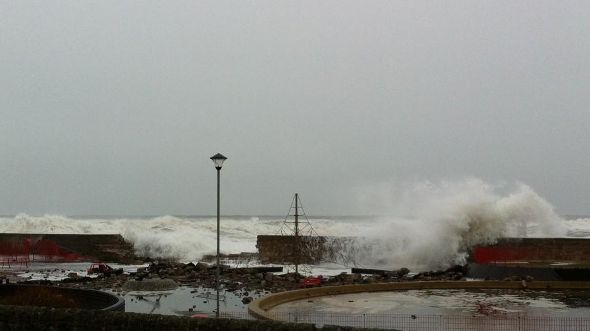
Waves overtopping the sea wall at Lossiemouth during the December 2012 storm, causing severe structural damage and flooding a park. Copyright: Barry Peach
It had been identified before the project commenced that wave overtopping is a key risk to communities in the Moray Firth and that quantifying this risk should be key component of the system. The 2012 event was largely wave driven and caused significant damage to harbours and shoreline properties, with an estimated £2.4m worth of damage caused in the Highland Council region alone. In 2013, a storm surge event propagated around the UK coast and although effects were focussed in SE England, preliminary data shows the UKCMF tide gauge at Aberdeen measured a 22yr return period (RP) for this event. In January 2014, another spring tide event occurred with Wick recording a 6yr RP. These three events in 13 months have heightened awareness amongst Government, local authorities and members of the public that more needs to be done to help minimise associated impacts from these types of events in the future.
The Moray Firth forecasting system will provide a sophisticated coupled modelling approach, including modelling waves from an offshore to nearshore environment in addition to wave overtopping modelling at selected sites. JFlow modelling software was utilised by the project team to create inundation mapping for the 14 wave overtopping sites, in order to gain an advanced appreciation of flow paths and high risk areas within these communities. The resulting Flood Warning Target Areas (FWTAs) have been largely based on these maps.
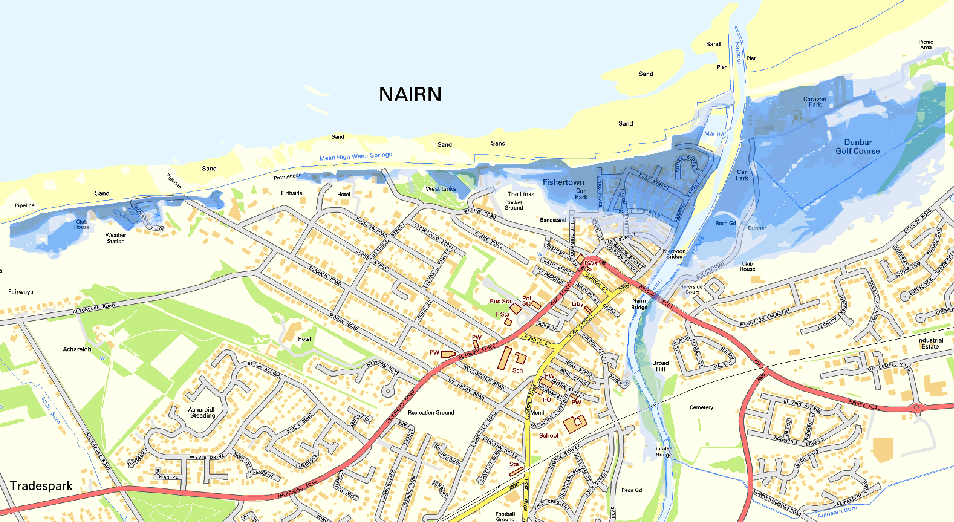
Modelled flood inundations from wave overtopping at Nairn, utilising JFlow modelling software. Set rates of overtopping were used to highlight where in the town will be most at risk during an event (darker blue shaded areas). Copyright: SEPA
In the Moray Firth modelling approach, a SWAN model (Simulating WAves Nearshore) has been developed comprising of an triangular mesh, allowing for coarser resolution in open water and finer resolution nearer the coast. This SWAN model will use data operationally from strategically-placed sample points, taken from the Met Office’s Euro 4 wave model (part of the Met Office Unified Model), propagating these around the model domain as appropriate. Each forecast location will show the output time series in metres, with the 14 wave overtopping locations then applying additional calculations to quantify the rate of overtopping in litres per metre per second (l/m/s). SEPA’s Flood Warning Duty Officer (FWDO) will then be able to analyse the wave conditions and model output, in conjunction with other variables such as SWL, wind direction etc, and relay this information with likely impacts to key responders and partners.
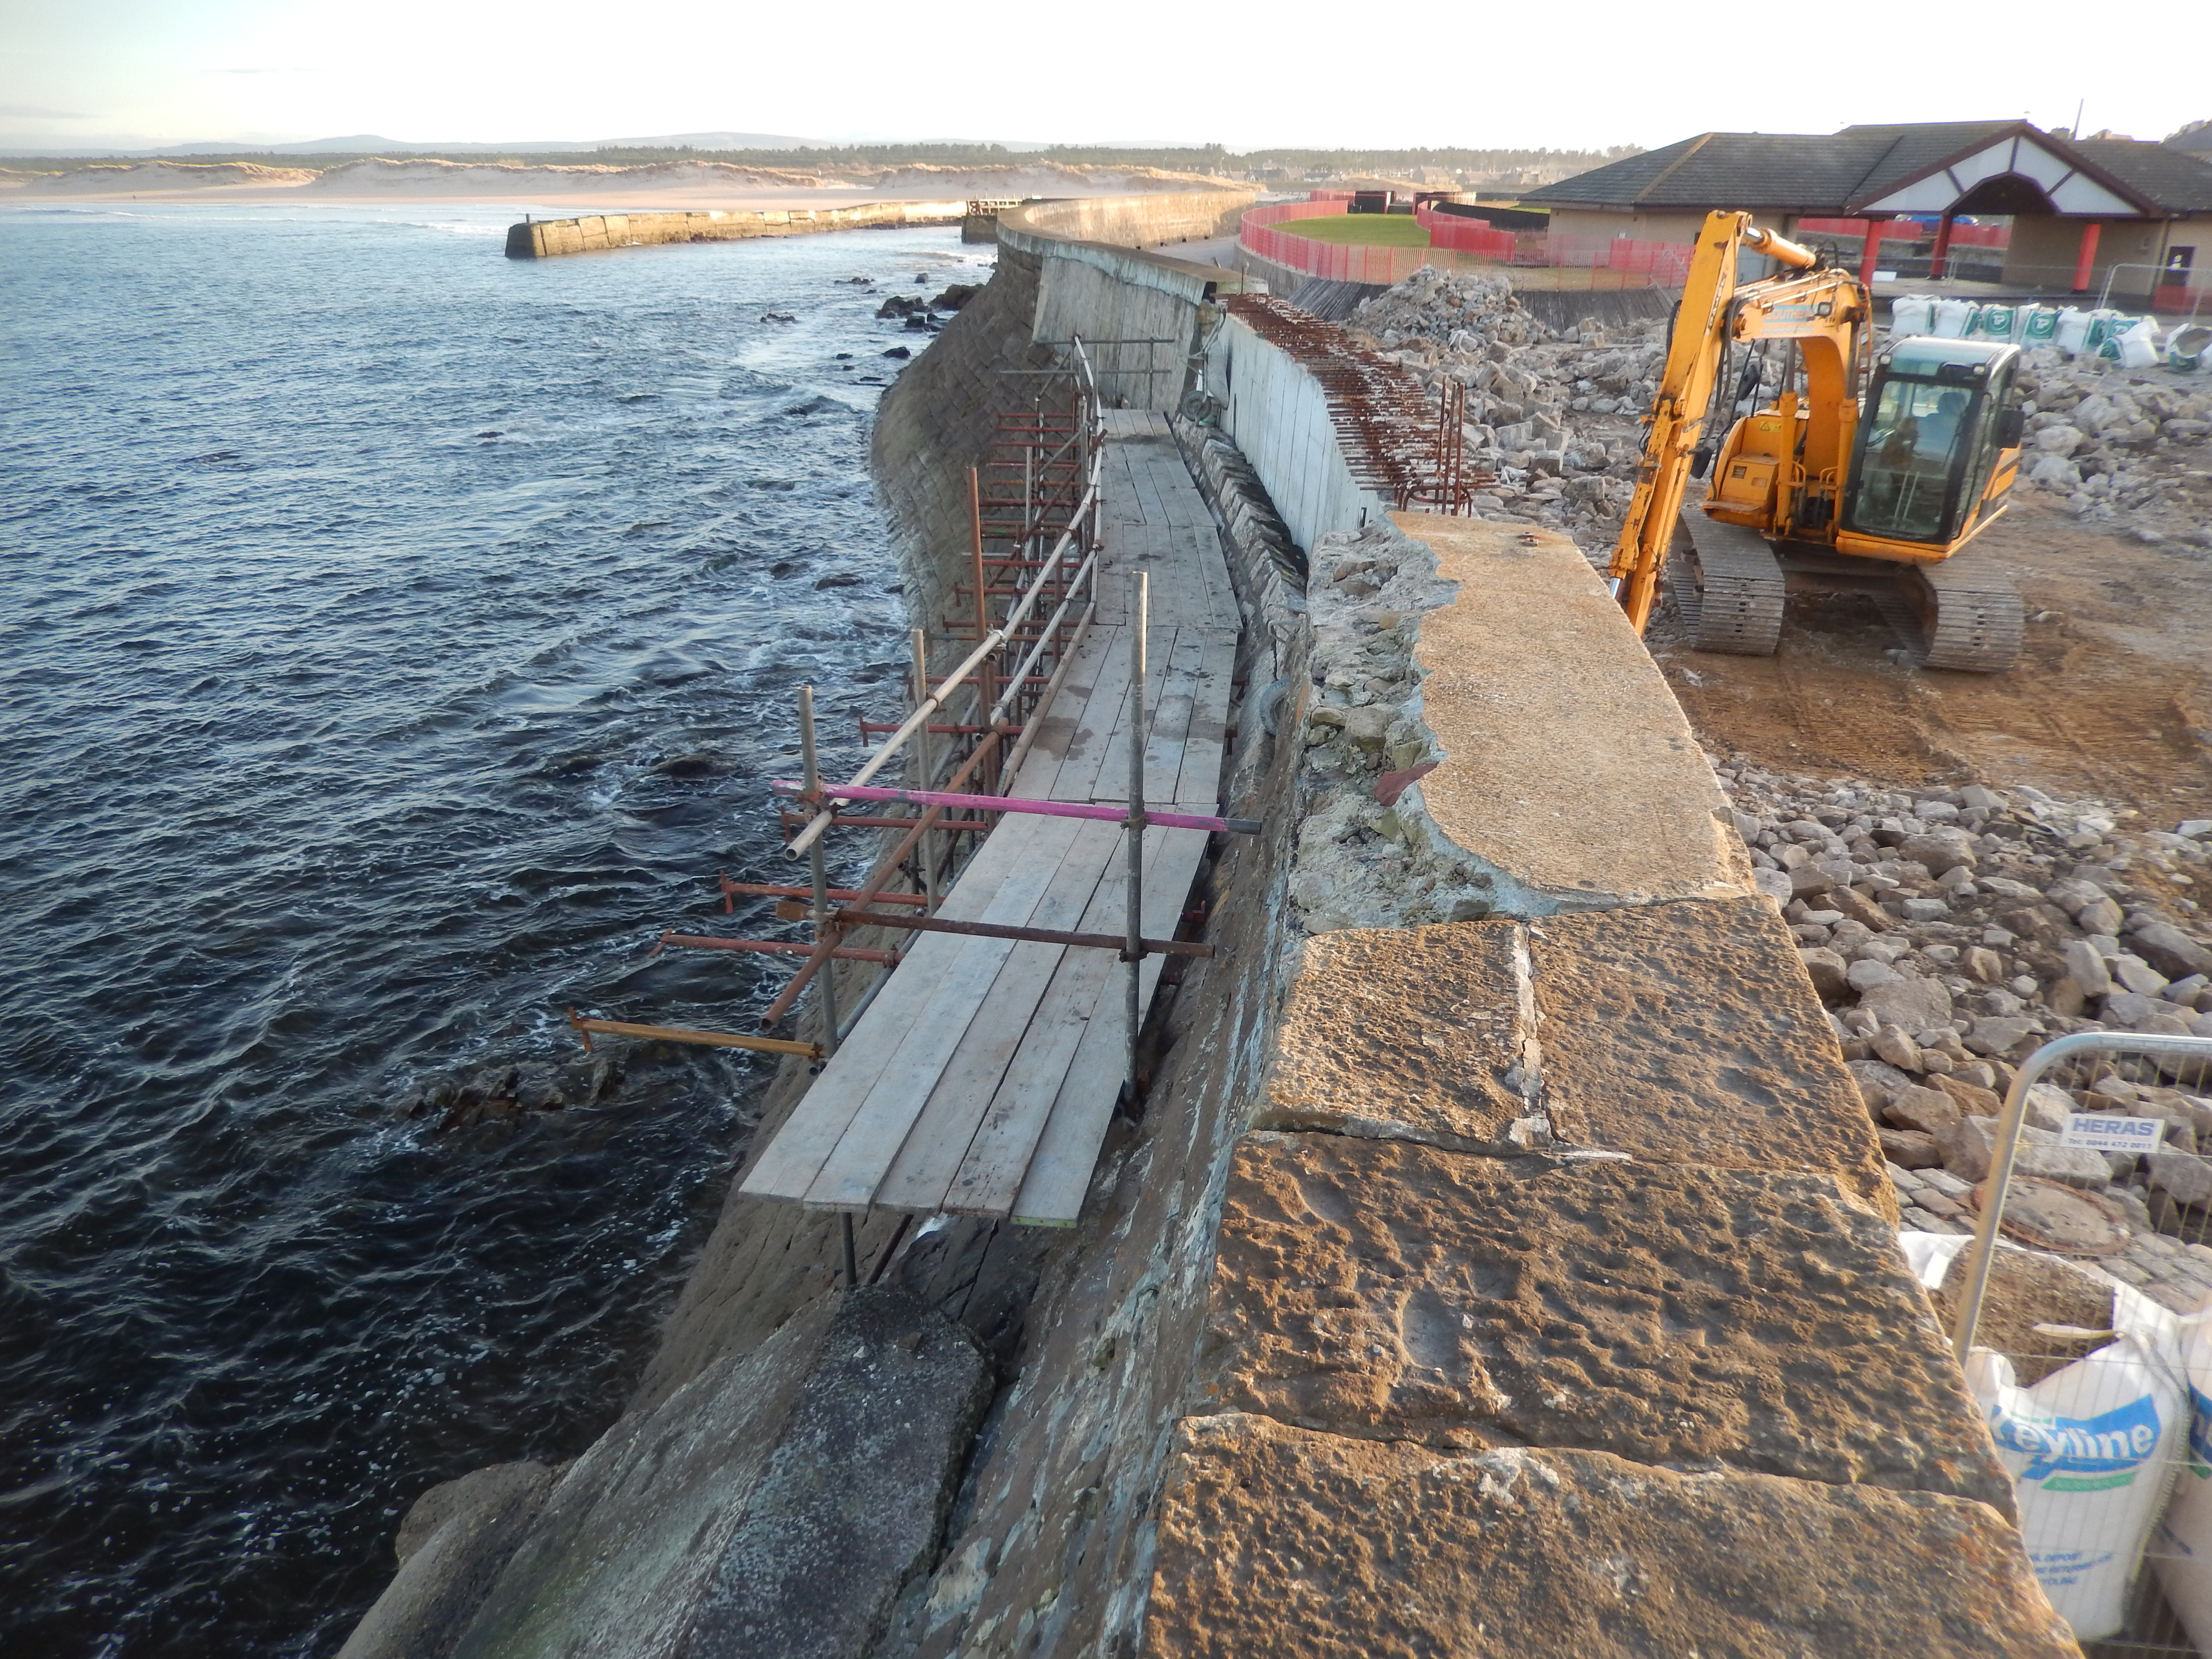
Ongoing repairs to Lossiemouth’s seawall as at 10 March 2014. Copyright: Darroch Kaye
The project team have utilised the WaveNet hindcast dataset to aid calibration of the models and to assess its performance against a lengthy still water level (SWL) time series. This 30yr 8km gridded dataset has been generated by running the WAVEWATCH III model, used operationally by the Met Office until the recent migration to the Euro4 wave model, with a wind field generated from re-analysis of historic observations. Wind forcing from downscaled 10m global wind fields from the ERA-Interim re-analysis, as provided by European Centre for Medium-Range Weather Forecasts (ECMWF), is also incorporated. There are 48 output parameters from the hindcast including significant wave height, mean wave direction and wave period, which in turn can be used to calibrate and verify wave models as well as recreate past events. More information regarding the differing types of ocean modelling the Met Office utilise can be found here.
The project is expected to be completed in early September 2014, with the forecasting system going live at the beginning of October 2014.
