Martyn Sunter contributes the first of a two-part feature on the climatology and hydrology of Scotland.

Martyn Sunter is Observations Quality Manager at the Met Office in Edinburgh.
Having worked for the Met Office in Scotland since 1994 I have experienced the challenges of monitoring and forecasting our interesting weather and climate. Here I provide some background on the climatology of Scotland with some examples that help demonstrate some of the geographical variations, and the extremes, of our unique climate.
Why is the weather such a common topic of conversation, even for those who have lived in Scotland all their lives and surely experienced, or at least heard of, all it has to offer? If someone who had never visited Scotland asked you to describe its climate, what would you say? Perhaps you might answer that is tends to be wetter in the west, and drier in the east, but the west is usually milder in winter. You may say it’s often cold and often windy, especially in the north. You might tell them that the spring and early summer can be dry and sunny and our warmest and sunniest days occur in the east, that’s if we escape the North Sea Haar. You could mention that the mountains and our vast coastline create large differences in the weather over short distances. Or you may answer with the often-used phrase ‘ Well, we get four seasons in one day!’
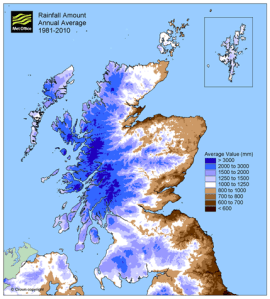
Fig 1. Annual average rainfall amount between 1981 and 2010.
Most people will be familiar with the typical patterns of weather that affect our country. Our location puts us the direct line of Atlantic low pressure systems bringing unsettled weather at any time of year, being most active during the winter months when fierce storms can sweep across the country. At the same time, we can enjoy fine, settled weather as high pressure becomes established, often bringing glorious weather during the spring time when students are busy revising for exams and facing the dilemma of deciding whether any productive work can be combined with lying in the sun! Our notoriously wet west coast and islands can experience the best weather in the country at these times as high pressure becomes established to the north of Scotland and easterly winds prevail. At the Met Office, our National Climate Information Centre produces charts, maps and summaries of our varied climate based on an interpolation of the surface observations network.
Clearly the topography of Scotland, with its steep mountains of the northwest Highlands, the Grampians further east and the Southern Uplands, have a major influence on our weather and climate. The roughly north to south orientation of our western highlands provide a barrier to the progress of weather systems and shelter to areas such as the Moray Firth. Our extensive coastline and islands and prevailing westerly wind mean that our weather is also governed by proximity to the sea. If we look at a map of average rainfall across Scotland, see fig 1, it highlights both the predominantly west to east flow of weather systems across the country and the variations due to topography. The western coast and islands bear the brunt of the Atlantic weather systems with the sheltered east coast to the lee of the Scottish mountain ranges being the driest parts of the country.
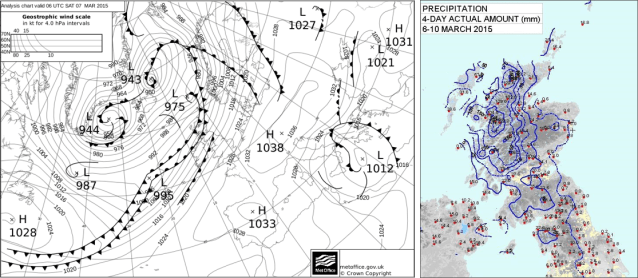
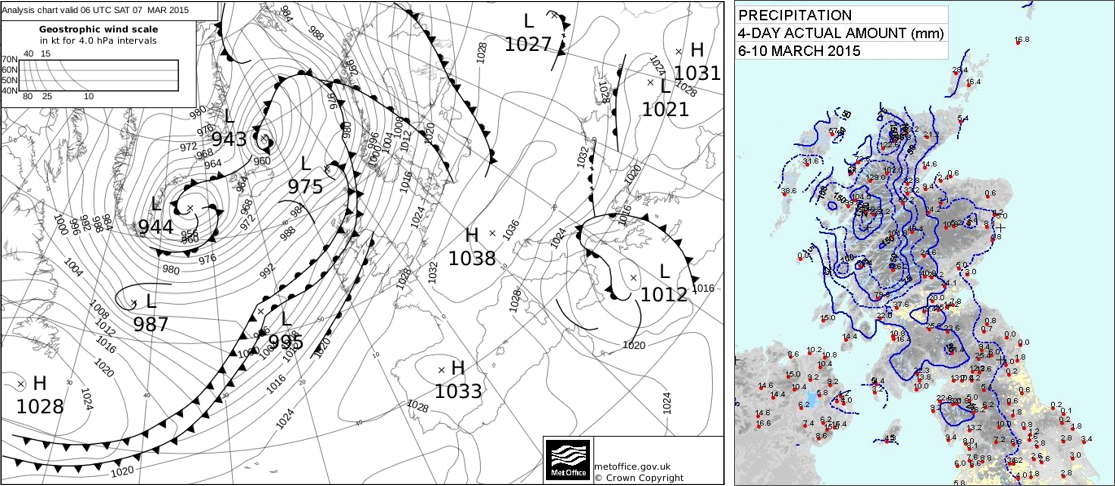
Fig 2 (left). Analysis chart for 0600UTC on Saturday 07th March 2015. Fig 3 (right). 4-day total precipitation amount from 6th to 10th March 2015
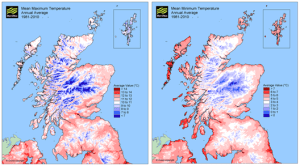
Figs 4 (left) and 5 (right). Annual average maximum and minimum temperature between 1981 and 2010.
The heavy rain affecting western Scotland over the weekend of 7-8 March 2015 is a good example of a moist south-westerly airflow, slow moving frontal systems and orographic enhancement, with the sheltered east remaining relatively dry (see fig 2). Flooding caused problems in a number of areas. The highest 4-day rainfall totals were not far off 200 mm (see fig 3), amounting to nearly the whole March long-term average at Plockton and Drumnadrochit.
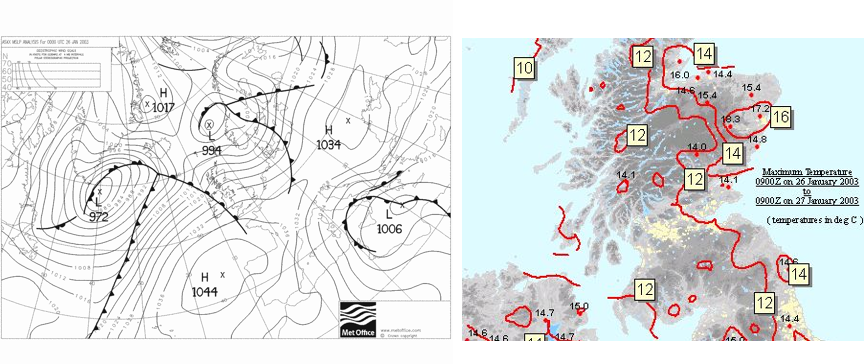
The temperature climate of Scotland is influenced by the topography and prevailing wind, (see figs 4 and 5). During warm sector conditions and westerly winds the east of Scotland (particularly to the lee of the Grampians) can experience a marked Fohn effect which can bring spring-like conditions during the winter. An extreme example of this is shown in fig 6. On 26th January 2003, record breaking temperatures for the time of year were measured in the east of Scotland (fig 7) with Aboyne reaching 18.3 Celsius (previous record was 14.1 Celsius) and Dyce reaching 17.2 Celsius (previous record was 15.1 Celsius).

Fig 6 (left). Analysis charts for 26th January 2003. Fig 7 (right). Maximum air temperature between 0900UTC on 26 January 2003 and 0900UTC on 27 January 2003
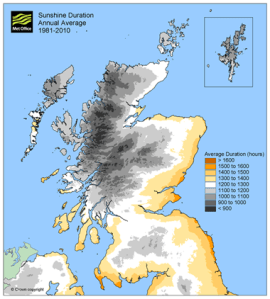
Fig. 8. Annual average sunshine duration between 1981 and 2010.
Figure 8 shows the average sunshine duration across Scotland, which ranges from less than 900 hours over parts of the northwest highlands to between 1500 and 1600 hours over the east of Fife, the Berwickshire coast and the southwest corner of Dumfries and Galloway. This is again a function of the mountainous regions bearing the brunt of rain bearing systems from the west and the upslope effects of cloud formation in moist westerly airflows and the drying of the air mass to the lee of high ground allowing cloud breaks and sunny periods. Frequent showers, blown in on west to northwest winds, particularly during the winter when they are generated by the relatively warm Atlantic in the unstable polar maritime air, bring cloud and showers to the northwest of the country whilst areas to the east of the Grampians and Southern Uplands stay relatively dry and sunny.
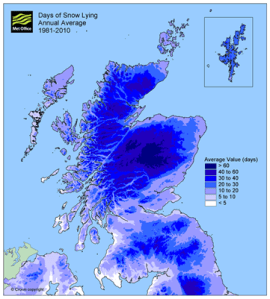
Fig 9. Annual average number of days of snow lying between 1981 and 2010.
Finally, a description of Scotland’s climate wouldn’t be complete without a look at snow. Figure 9 shows the average number of days with lying snow per year. As you would expect, it follows the topography of the country, but looks rather different to the rainfall map of figure 1. The area affected by snow the most is centred over the Grampian mountains, with Shetland experiencing a fair amount of snow too. Snow events in Scotland are often associated with arctic air masses brought in on northerly winds, hence the reason Shetland sees more than its fair share. Similarly, the northeast of mainland Scotland is exposed to those northerly winds and bears the brunt of frequent snow showers, more organised areas of wintry precipitation associated with fronts or troughs in the northerly flow, or even polar lows. The winter of 2013/2014 saw an unusually large amount of snow affecting the hills and mountains of Scotland, which was great for the ski centres, which had almost too much snow at times, but with surprisingly little reaching low levels. A series of frontal systems brought heavy precipitation across the country, with frequent periods of heavy snow affecting the hills and mountains, but often just rain or sleet at low levels.
So can the weather in Scotland be described as ‘four seasons in one day’. I’m not a fan of the saying personally. Perhaps it refers to showery days such as in the spring time where we might have a brief rain shower and some gusty winds, followed by some pleasant sunshine and relative warmth and just a light breeze, then perhaps followed by a hail shower and squall, then back to sunshine , but now feeling noticeably colder. Or perhaps it refers to the passage of frontal systems where we can experience three different air masses in the space of one day interspersed with periods of dry weather and rain and changing temperatures and winds. But, if we live in Scotland, surely we’re used to all that, and that’s what makes our climate so interesting and challenging.