
One of the challenges we face in the forecasting service when looking at flow outputs modelled from high resolution rainfall forecasts is knowing when to act – Just because we see a realistic looking peak on a forecast at day 5 doesn’t mean we should immediately believe that the event will happen. Equally, we should not just ignore such forecasts. A recent sequence of forecasts from the Grid-to-Grid model serves to illustrate our approach.
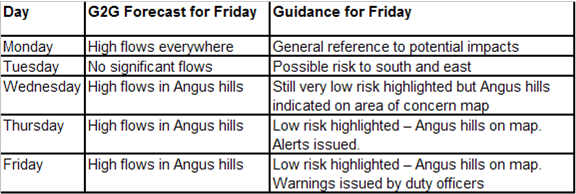
During the week leading up to Friday 25th October a succession of forecasts indicated that some flood related activity could be a possibility on the Friday. On the Monday there was a strong signal for high flows in most parts of southern Scotland for Friday. At this stage we relied on the forecasting service meteorologist’s view as to the likelihood of this event, and kept it in mind. As the week went on, the forecasts pointed more to a potential event in the Angus hills to the east of Scotland, and with forecaster professional judgement and Met Office guidance giving confidence in that outcome, the Flood Guidance Statement became more focussed on that area.
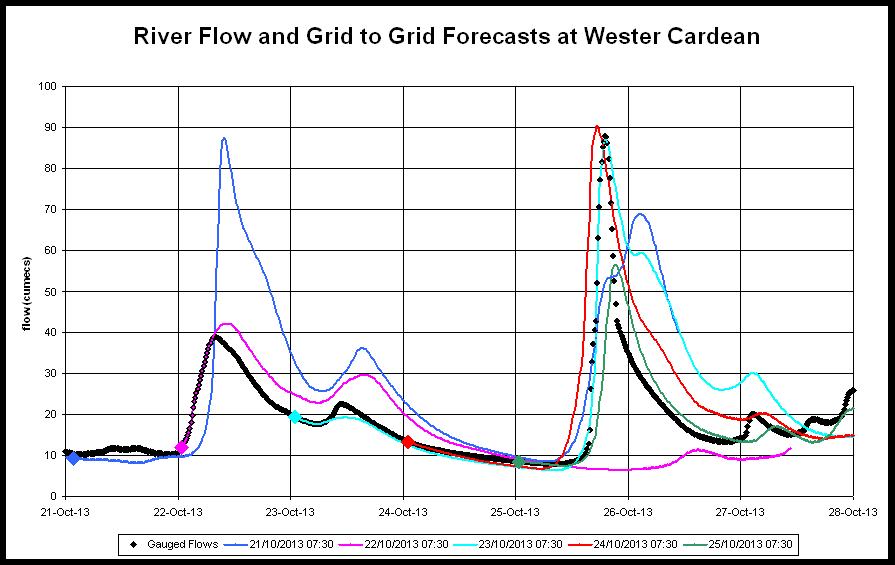
Grid-to-Grid forecasts and gauged flows at
Wester Cardean gauging station
Figure 1 shows the flows for a site in the risk area, forecast on subsequent days in the run up to October 25th. The actual gauged flows are also plotted.
The table below summarises the forecasts and the associated guidance issued for that particular area. Other neighbouring sites gave a similar picture. The guidance for the Thursday is summarised in the Area of Concern map in Figure 2.
Forecasts from Mon 21 to Fri 25 October,
with associated forecaster guidance for Fri 25.
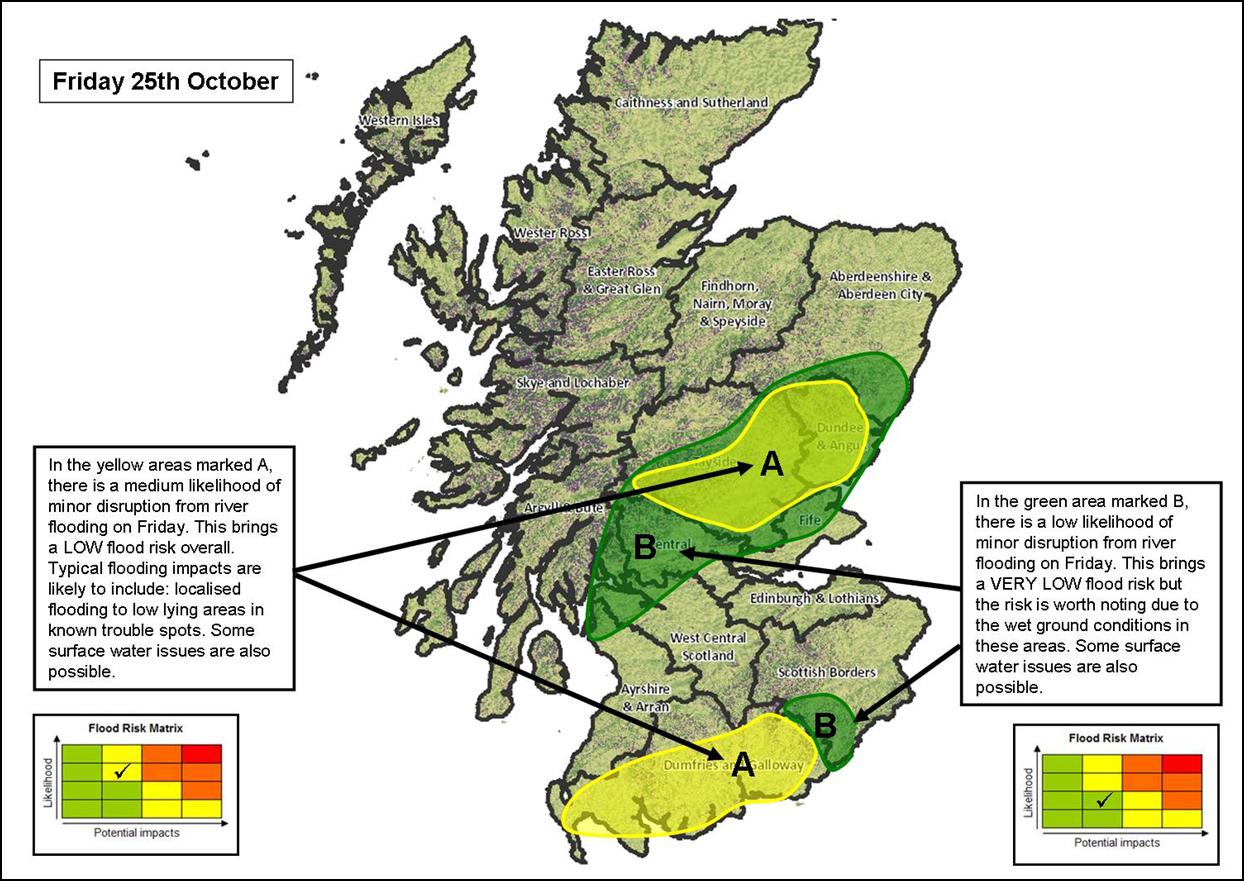
Figure 2 – Area of Concern map. Area in question is the more northerly yellow one.
As can be seen in Figure 1 above, the actual flows at Wester Cardean on the Friday were very similar to those forecast throughout the week (with the exception of Tuesday, which was recognised as anomalous by the forecaster). A Flood Alert for that area was issued on Thursday, followed by the more targeted Flood Warning for the River Isla which was issued on Friday. This wasn’t a large event – impacts were restricted to flooding of agricultural land – but the consistent forecasts in the run up ensured that all operational staff and responders were fully prepared for what might happen.
This example implies that in future we should be able to use the evolving technology to identify significant impact events, at longer ranges, with more confidence.
